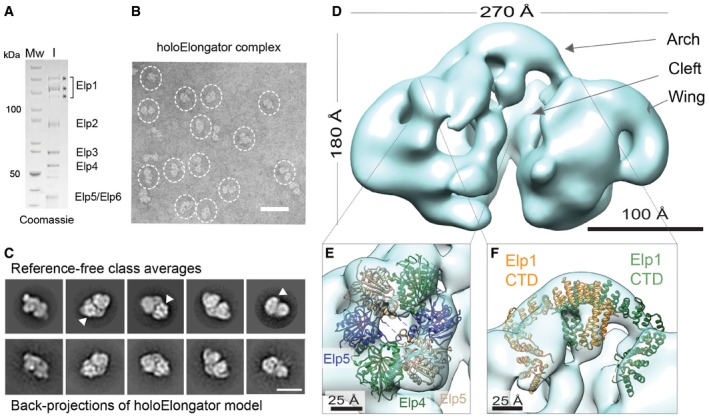
Figure 1. EM reconstruction of endogenous holoElongator.

- SDS–PAGE gel showing the purified holoElongator complex used as input for gel filtration. Protein bands marked with asterisks presumably correspond to different phosphorylation states of Elp1 that have been previously described 34.
- Representative negative‐stain EM field of the holoElongator complex. Particles in side and tilted views are highlighted. Scale bar, 50 nm.
- Reference‐free class averages and back‐projections of the holoElongator model. Hexameric ring‐shaped densities and the asymmetric side view are indicated (arrowheads). Scale bar, 20 nm.
- EM reconstruction of the holoElongator complex at 31 Å resolution.
- Fitting of the Elp456 crystal structure into the ring density of the holoElongator reconstruction.
- Fitting of the Elp1 CTD into the holoElongator reconstruction.
