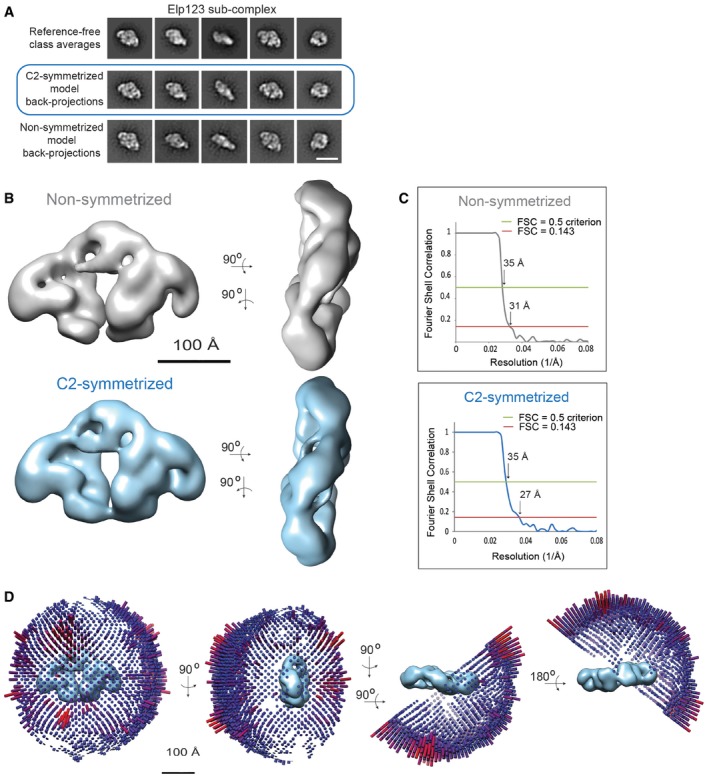
Figure EV3. EM analysis of the Elp123 sub‐complex.

- Comparison between the Elp123 reference‐free class averages (upper row), the back‐projections of the C2‐symmetrized Elp123 model (middle row) and the back‐projections of the non‐symmetrized Elp123 model (lower row). Scale bar, 20 nm.
- Comparison between the non‐symmetrized (in gray) and the C2‐symmetrized (in blue) Elp123 models in two different views. The scale bar corresponds to 100 Å.
- Fourier Shell Correlation curve for the non‐symmetrized and the C2‐symmetrized Elp123 models. The red line indicates FSC = 0.143 and the green line shows FSC = 0.5.
- Euler plots for the angular distribution of holoElongator model in four different views.
