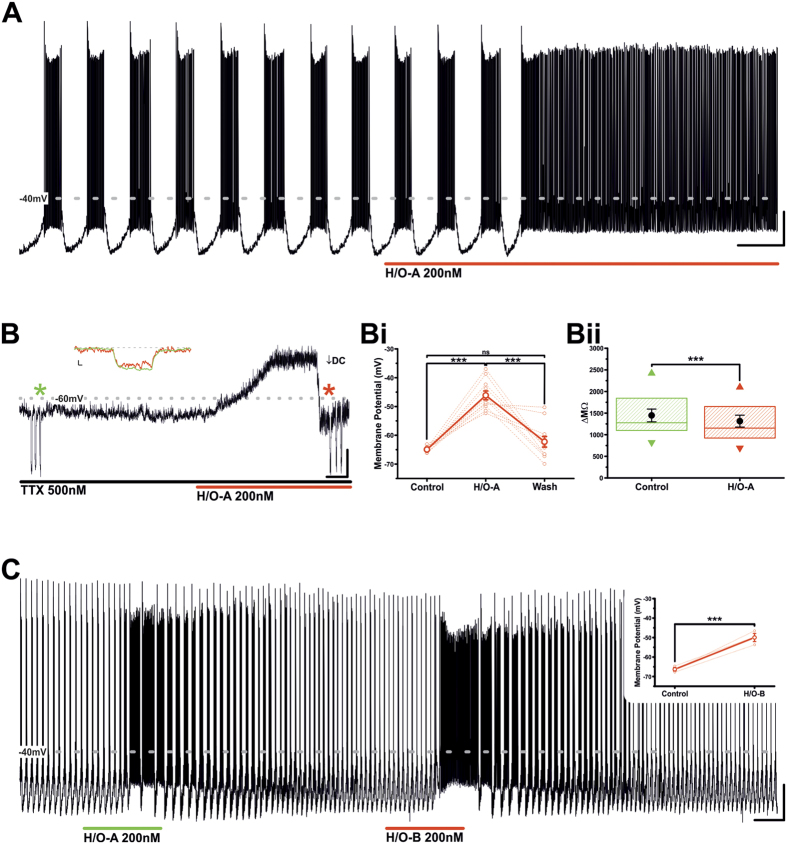
Figure 2. Hypocretin/Orexin-A and B excite TIDA neurons.
(A) Current clamp recording of an oscillating TIDA neuron. Application of H/O-A results in excitation and a switch from phasic to tonic firing. Scale bar 20 mV/20Sec. (B) Current clamp recording of a TIDA neuron in the continuous presence of TTX, applied to abolish oscillation to achieve a stable baseline. Prior to application neuron was held at −65 mV with negative DC current injection and input resistance assessed with test pulses of −20pA ( ). The H/O-A induced depolarisation endured in the presence of TTX. To compare input resistance at peak of response with that in control, membrane potential was returned to −65 mV with additional negative DC current injection (↓) and identical test pulses reapplied (
 ). Inset are examples of control (green) and response (red) test pulses superimposed. Scale bar 10 mV/10 Sec; inset 5 mV/50 mSec. (Bi) Population data from recordings as illustrated in (B). Application of H/O-A causes a reversible and significant depolarisation of resting membrane potential. The mean membrane potential in control, H/O-A and wash is represented by the solid line. Raw data used to produce means shown as dashed lines (n = 11; ***P < 0.001; ns; ANOVA repeated measures with post-hoc Tukey test). (Bii) The H/O-A induced depolarisation is associated with a significant decrease in input resistance (n = 11; ***P < 0.001; paired t-test). Boxes represent 25, 50 and 75 percentile with superimposed Mean ± SEM and maximum and minimum values. (C) Current clamp recording of a TIDA neuron exposed to H/O-A and, following wash and return to baseline conditions, H/O-B. Note similar reversible depolarising response to both peptides. Scale bar 20 mV/2 min. Inset – in the presence of TTX, H/O-B application causes a significant depolarisation of membrane potential. The mean membrane potential in control and H/O-B is represented by the solid line. Raw data used to produce means shown as dashed lines (n = 3; ***P < 0.001; paired t-test).

