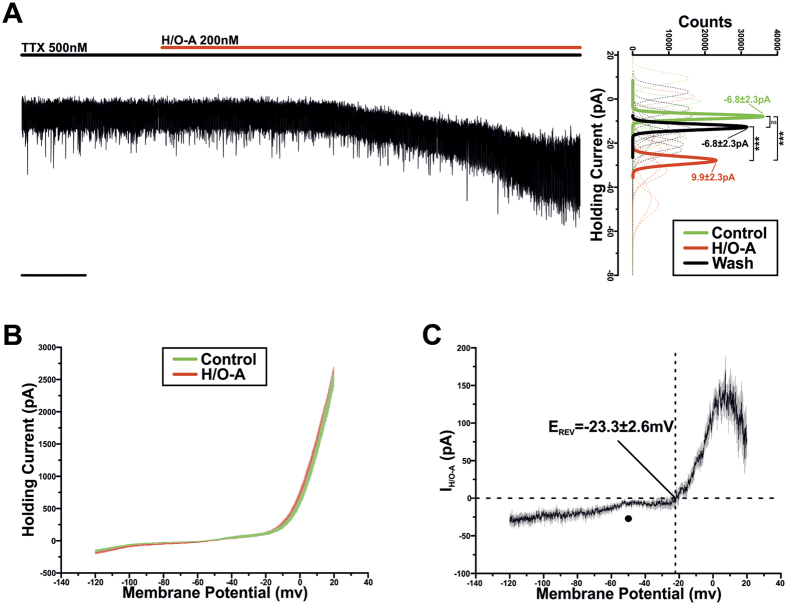
Figure 3. Hypocretin/Orexin-A activates an inward current.
(A) Voltage clamp recording of a TIDA neuron in the presence of TTX applied to abolish oscillation and achieve a stable baseline. Application of H/O-A results in an inward current (Scale bar 20 Sec). To the right, sharing its y-axis with the raw trace, are Gaussian fits of averaged (solid lines) holding current frequency distributions in control (green), H/O-A (red) and wash (black). Raw data used to produce averages shown as dashed lines (n = 9; ***P < 0.001; ANOVA repeated measures with post-hoc Tukey test). (B) Averaged voltage clamp ramps (n = 9) acquired in control (green) and at the peak of response (red). Line = mean; shading = SEM. (C) H/O-A –induced current (IH/O-A) obtained by the digital subtraction of the traces displayed in (B). Note the negative slope conductance at −50 mV (●) and reversal at −23.3 ± 2.6 mV. Line = mean; shading = SEM.

