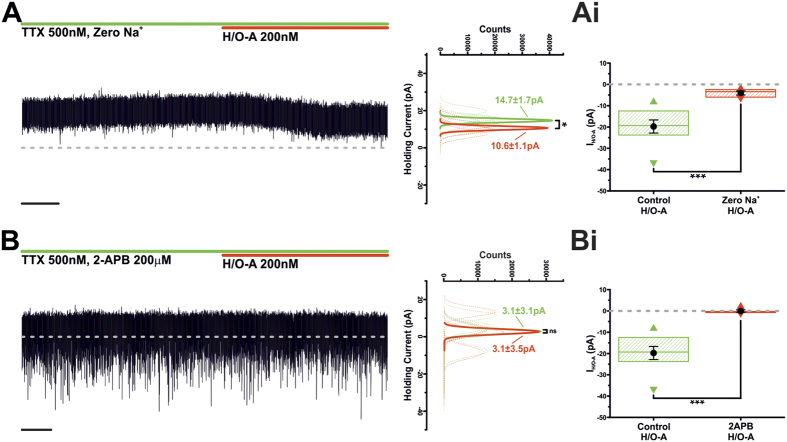
Figure 5. IH/O-A is mediated by a Na+-dominated mixed cationic current.
(A) Voltage clamp recording of an oscillating TIDA neuron in the presence of TTX and ‘Zero Na+’ recording solution. Application of H/O-A induced a small, yet significant, inward current (Scale bar 20 Sec). To the right, sharing its y-axis with the raw trace, are Gaussian fits of averaged (solid lines) holding current frequency distributions in control (green) and H/O-A (red). Raw data used to produce averages shown as dashed lines (n = 5; *P < 0.05; paired t-test). (Ai) Application of H/O-A in ‘Zero Na+’ recording solution results in a significant reduction in IH/O-A when compared to control (Control, n = 9; ‘zero Na+’, n = 5; ***P < 0.001; unpaired t-test). Box plot organised as Fig. 2Bii. (B) Voltage clamp recording of a TIDA neuron in the presence of TTX and 2-APB (200 μM). Application of H/O-A failed to induce an inward current (Scale bar 20 Sec). To the right, sharing its y-axis with the raw trace, are Gaussian fits of averaged (solid lines) holding current frequency distributions in control (green) and H/O-A (red). Raw data used to produce averages shown as dashed lines (n = 5; ns; paired t-test). (Bi) Application H/O-A in the presence of 2-APB results in an abolishment of IH/O-A (Control, n = 9; 2-APB, n = 5; ***P < 0.001; unpaired t-test). Box plot organised as Fig. 2Bii.

