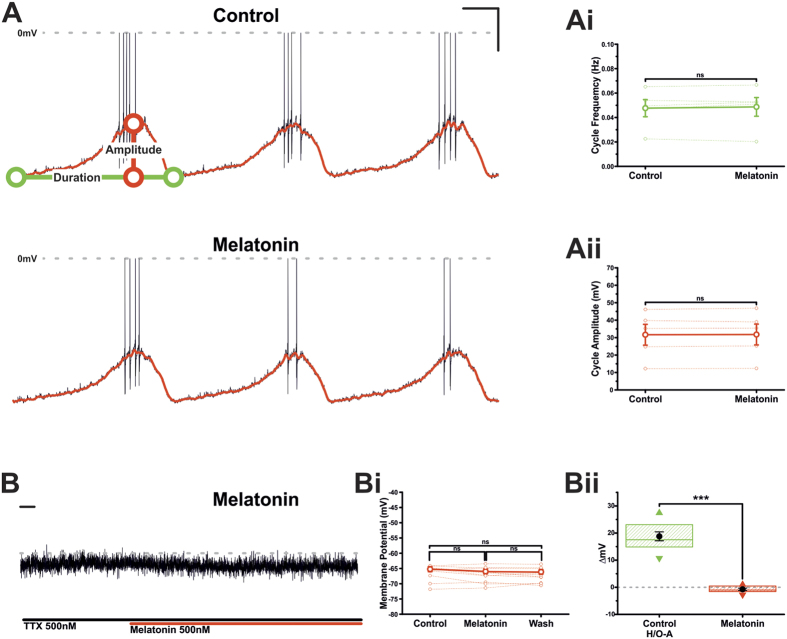
Figure 7. Melatonin fails to excite TIDA neurons.
(A) Current clamp recording of an oscillating TIDA neuron in control and the presence of melatonin (500 nM). Scale bar 20 mV/4 Sec. (Ai) Application of melatonin failed to result in a significant change in oscillation cycle frequency. The mean value is represented by the solid line. Raw data used to produce means shown as dashed lines (n = 5; ns; paired t-test). (Aii) Application of melatonin failed to result in a significant change in oscillation cycle amplitude. The mean value is represented by the solid line. Raw data used to produce means shown as dashed lines (n = 5; ns; paired t-test). (B) Current clamp recording of a TIDA neuron in the continuous presence of TTX to abolish oscillation and achieve a stable baseline. Membrane potential remained unchanged after application of melatonin. Scale bar 20 Sec. (Bi) Sharing its y-axis with the raw trace in B, is the mean (solid line) membrane potential in control, melatonin and wash. Raw data used to produce averages shown as dashed lines (n = 10; ns; ANOVA repeated measures with post-hoc Tukey test). (Bii) Application of the melatonin failed to result in a significant change to TIDA neuron membrane potential, a response significantly different to that of control H/O (Control n = 11; Melatonin n = 10; ***unpaired t-test). Box plot organised as Fig. 2Bii.

