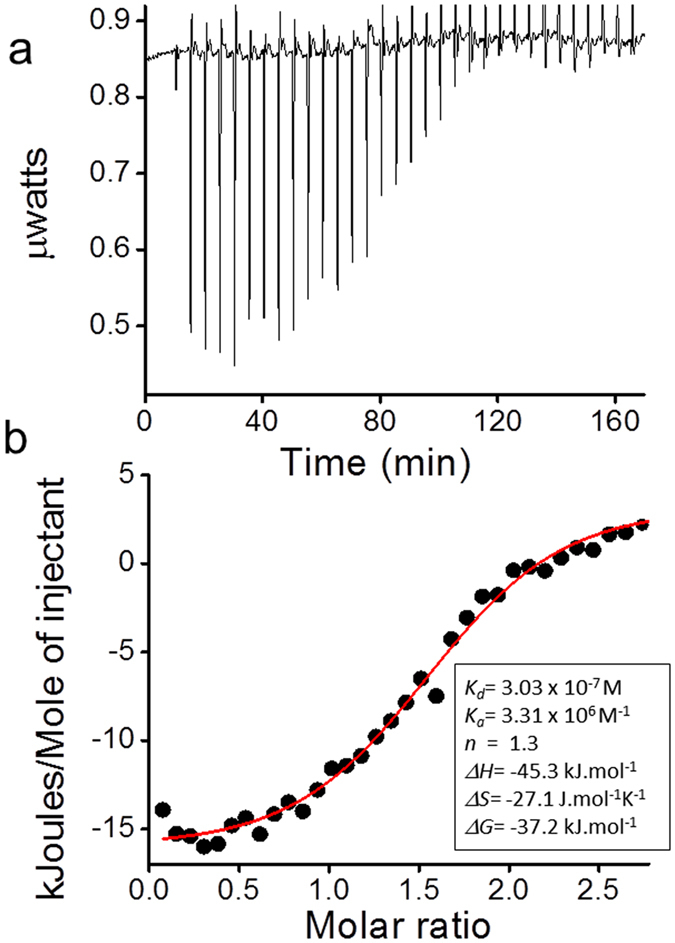
Figure 4. Interaction of insulin with eugenol by Isothermal Titration Calorimetry (ITC).

(a) Raw data (after baseline subtraction) obtained from ITC for titration of insulin (10 μM) with ligand eugenol (125 μM) in PBS at pH 7.4 and at 298 K, revealing the calorimetric response peaks in μWatt during successive injections of eugenol to the insulin sample cell. Raw signal obtained from ITC is shown in Supplementary Figure S13. (b) Integrated heat profile of ITC data showing the binding enthalpies corrected for heat of ligand injection. The solid line represents the minimized independent fitting by a model of one site per monomer (using Nano Analyze 2.1 software from Thermal Analysis). Inset of panel b lists the thermodynamic parameters obtained for insulin-eugenol interaction.
