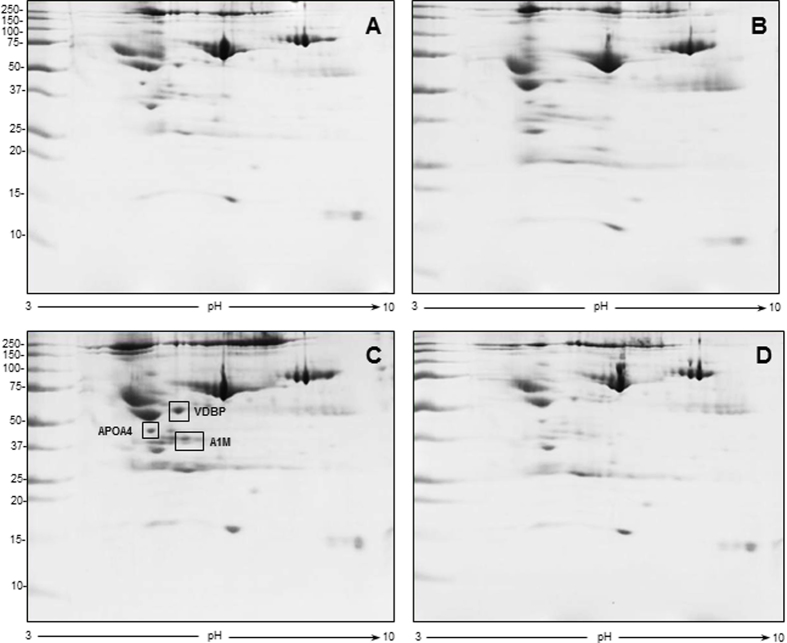
Figure 3. Representative 2D gel images for the 2 week time interval after surgery.
First-dimension separation was obtained by IPG strip, pH range 3–10; second-dimension separation was achieved by 8–16% gradient gel. (A) sham-operated group treated with saline, (B) sham-operated group treated with indomethacin, (C) CCI-saline, (D) CCI-indomethacin. In panel C, rectangles indicate the increased proteins vs panel D, identified by MS and listed in Table 2 (VDBP: Vitamin D-binding protein, APOA4: Apolipoprotein A-IV, A1M: Alpha-1-macroglobulin).

