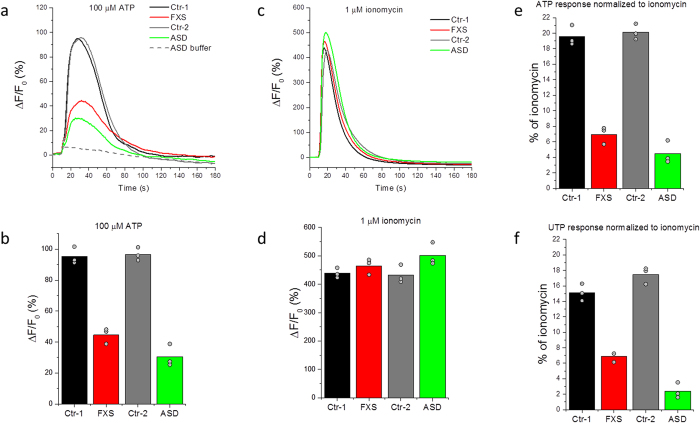
Figure 1. Representative Ca2+ responses to extracellular application of purinergic agonists and ionomycin in absence of extracellular Ca2+ in fibroblasts from ASD subjects and controls.
(a) Representative FLIPR traces showing changes in Fluo-8 fluorescence over the basal fluorescence (ΔF/F0) in response to extracellular application of 100 μM ATP to fibroblast cell lines from two controls (black; GM03440 and grey; GM02912), one FXS (red; GM09497) and one sporadic ASD subject (green; AU0027-0202). Fluorescence changes ΔF are presented as a % change from the basal fluorescence F0. The grey dashed line represents the artifactual fluorescence change resulting from addition of vehicle alone to the ASD cell line. (b) Peak amplitudes (ΔF) of Ca2+ responses to 100 μM ATP normalized to the basal fluorescence (F0) before stimulation in control cell lines (black and grey), FXS (red) and a sporadic ASD line (green). Bar graphs show mean of triplicate measurements after subtracting the artifactual signal resulting from addition of vehicle alone to each corresponding cell line. Data points represent individual triplicate responses. (c) Representative FLIPR traces showing changes in fluorescence over the basal (ΔF/F0) in response to extracellular application of 1 μM ionomycin to control (black and grey traces), FXS (red) and ASD (green) cell lines. (d) Mean peak Ca2+ responses (ΔF) to 1 μM ionomycin normalized to the basal fluorescence (F0) before stimulation in control cell lines (black and grey), FXS line (red) and an ASD line (green). Bar graphs show mean of triplicate measurements. Data points represent individual triplicate responses. (e) Mean peak ATP responses for each cell line from (b) expressed as a percentage of the mean ionomycin response from (d) in that cell line. (f) Mean peak responses evoked by addition of 100 μM UTP to each cell line as a percentage of the of ionomycin response for that cell line.

