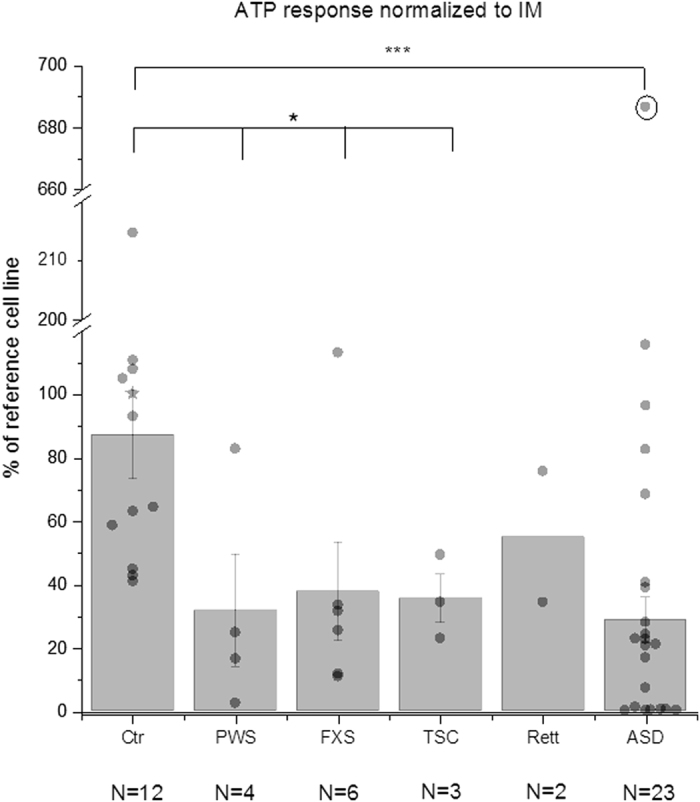
Figure 2. Ca2+ response in fibroblasts from subjects with sporadic ASD as well as from controls and those with syndromic ASD.

Average Ca2+ response in skin fibroblasts from unaffected neurotypical controls (Ctr), Prader-Willi syndrome (PWS), fragile X syndrome (FXS), tuberous sclerosis syndrome 1 and 2 (TSC), Rett syndrome (Rett) and from subjects with sporadic ASD (ASD). N below each cell line represents number of individuals tested. The star symbol represents the reference control cell line (GM03440). Peak Ca2+ response (ΔF/F0) divided by the peak ionomycin response (ΔF/F0) was normalized to the mean value of the reference cell line (GM03440) run on the same FLIPR plate. Bar graphs show mean +/− SEM for each group. Data points represent responses from an individual. Circled data point (AU0237-0201) was excluded from the average and statistics. *p-value < 0.05, ***p < 0.001, Mann-Whitney test.
