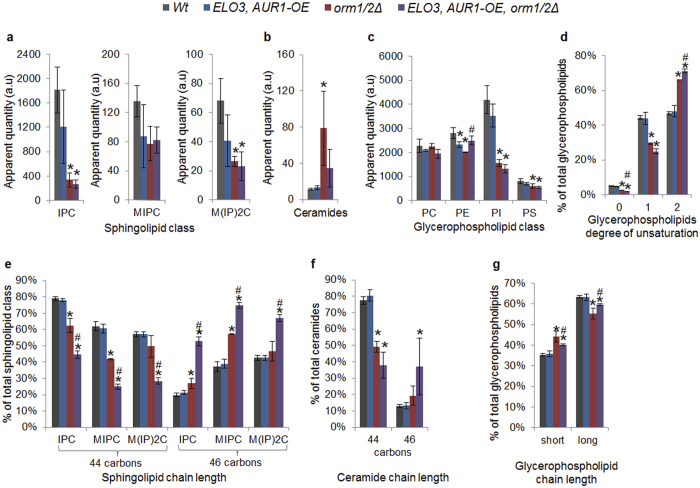
Figure 2. Lipid profiles of the constructed strains analysed during mid-exponential growth in minimal medium supplemented with amino acids.
(a) Complex sphingolipid classes. (b) Total ceramides. (c) Glycerophospholipid classes. (d) Degree of unsaturation per lipid in total glycerophospholipids. (e) Complex sphingolipid total chain length per lipid. (f) Ceramide chain length per lipid. (g) Total glycerophospholipid chain length per lipid. *Significant difference compared to wild type. #Significant difference compared with orm1/2Δ mutant. Differences obtained using one-way ANOVA with post-hoc Tukey HSD for multiple pairwise comparisons (p < 0.05). The results were calculated from three biological replicates and are given as the mean ± standard deviation.

