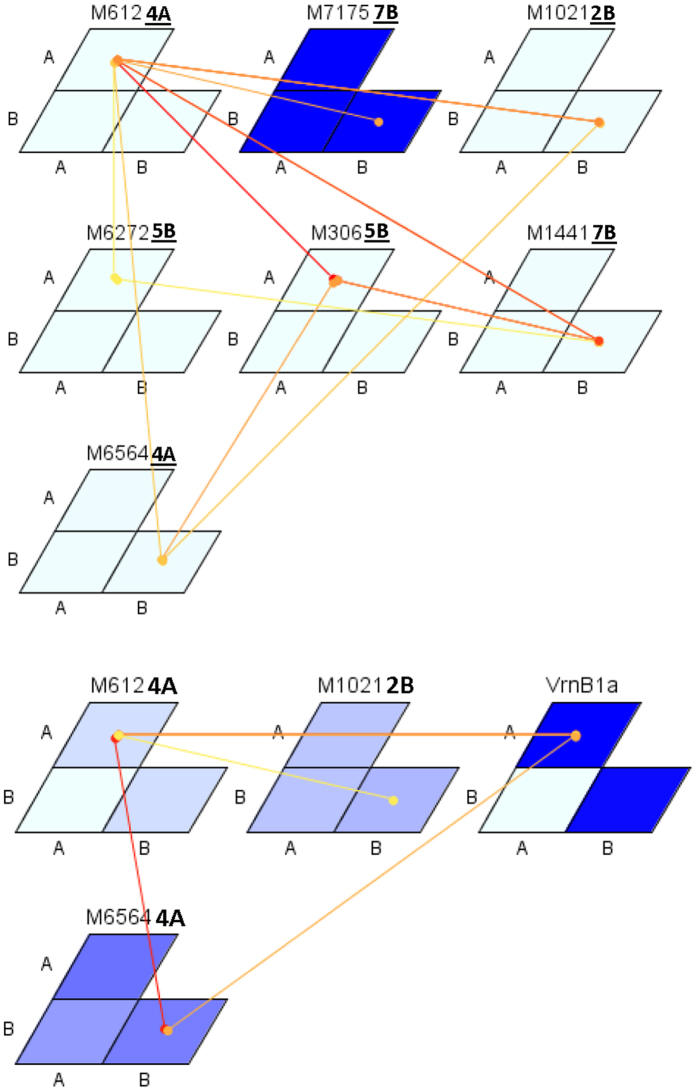
Figure 4. Epistatic interactions for yield stability coefficient without (above) and with (below) major genes included in model.
Each matrix indicates one marker. The A and B are the two alleles for each marker. The magnitude of marker effect (F value) is represented with shades of blue (dark blue with stronger interaction). The magnitude of epistatic interaction is presented with colors from yellow to red (stronger interaction).

