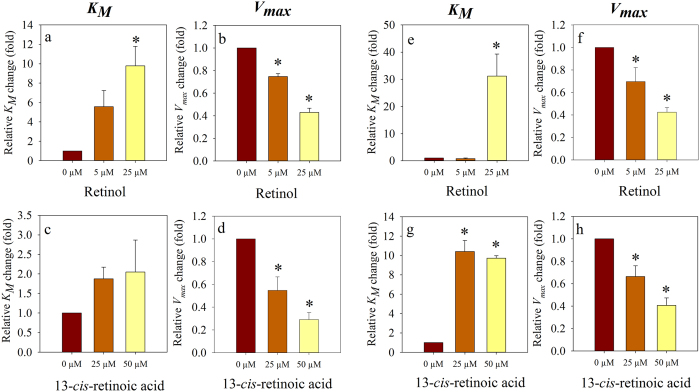
Figure 6.
Changes of apparent KM and vmax values of the Pgp- (a–d) and ABCG2-mediated (e–h) ATPase activity in response to retinol and 13-cis-retinoic acid treatment. The apparent KM and vmax values were obtained by curve-fitting to a modified form of the Michaelis-Menten equation (see Materials and Methods). The ATPase activity of Pgp (a,b,c and d) and ABCG2 (e,f,g and h) was stimulated by 40 μM verapamil and 10 μM quercetin, respectively. (*Significant difference compared to control (n = 3, mean ± SEM, ANOVA, Holm-Sidac post-hoc analysis, P < 0.05)).

