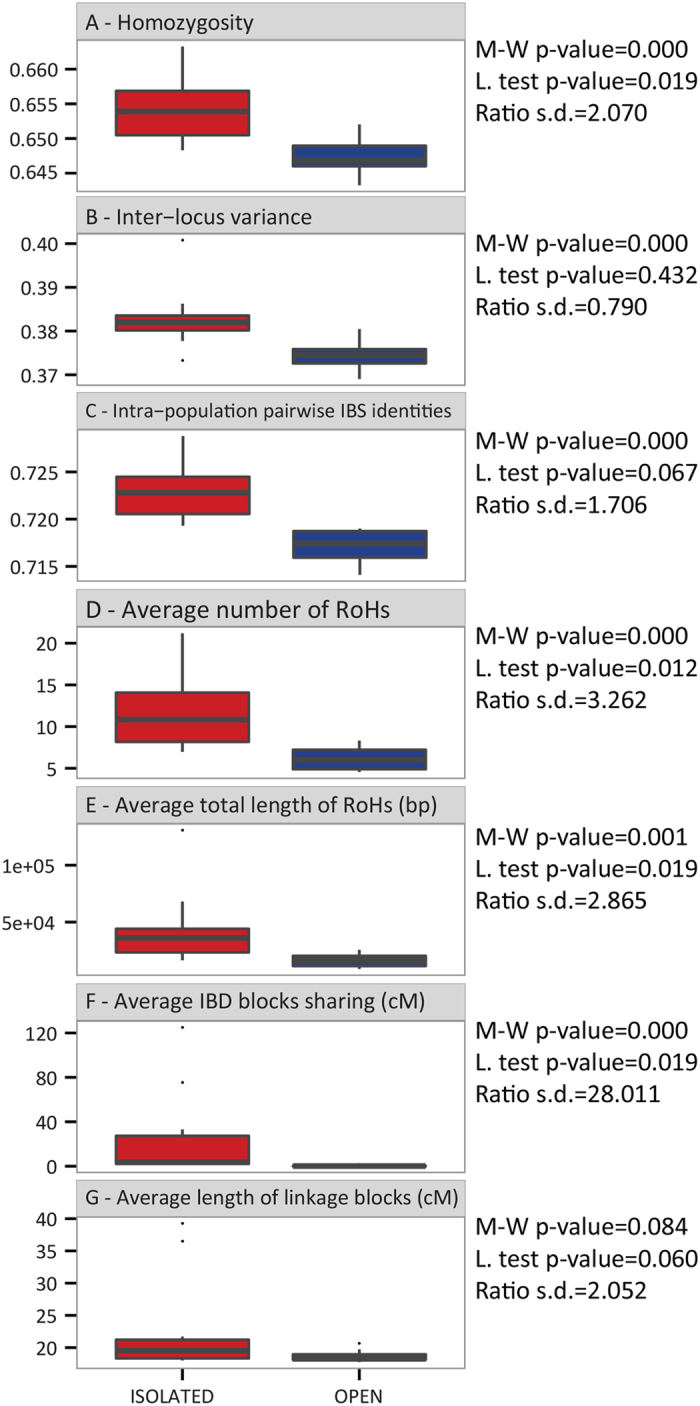
Figure 2.

Boxplots of (A) Average homozygosity over loci (B) Inter-locus variance (C) Average number of RoHs (D) Average total length of RoHs (E) Average intra-population pairwise IBS (F) Average population IBD blocks sharing (G) Average length of linkage blocks. M-W stands for Mann-Whitney U test, L. for Levene test and s.d. for standard deviation (the tests of the last two statistics were performed excluding the outlier values).
