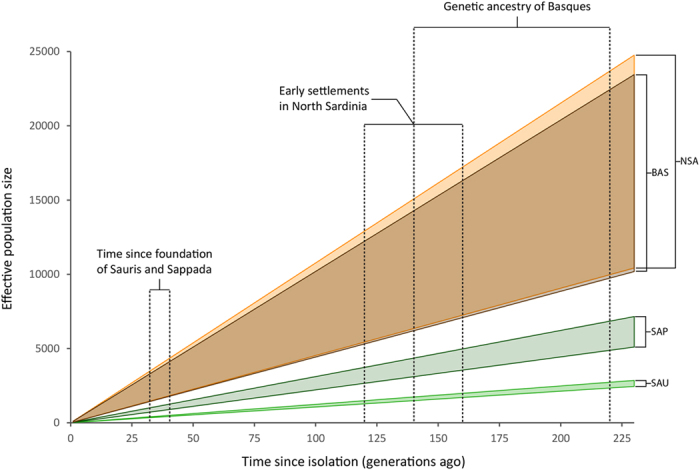
Figure 5. Numbers of generations since isolation (X axis) and corresponding Ne values (Y axis) under a model of constant population size in populations which retain clear signatures of isolation (Basques, North Sardinia, Sappada and Sauris; see also PC1 in Fig. 3).

For each population at any given time since isolation, the upper and lower boundaries of Ne were obtained assuming the initial inbreeding coefficients to be equal to the highest and lowest values observed among open populations, respectively. References for time since isolation (indicated by arrows) are reported in Supplementary Text S1.
