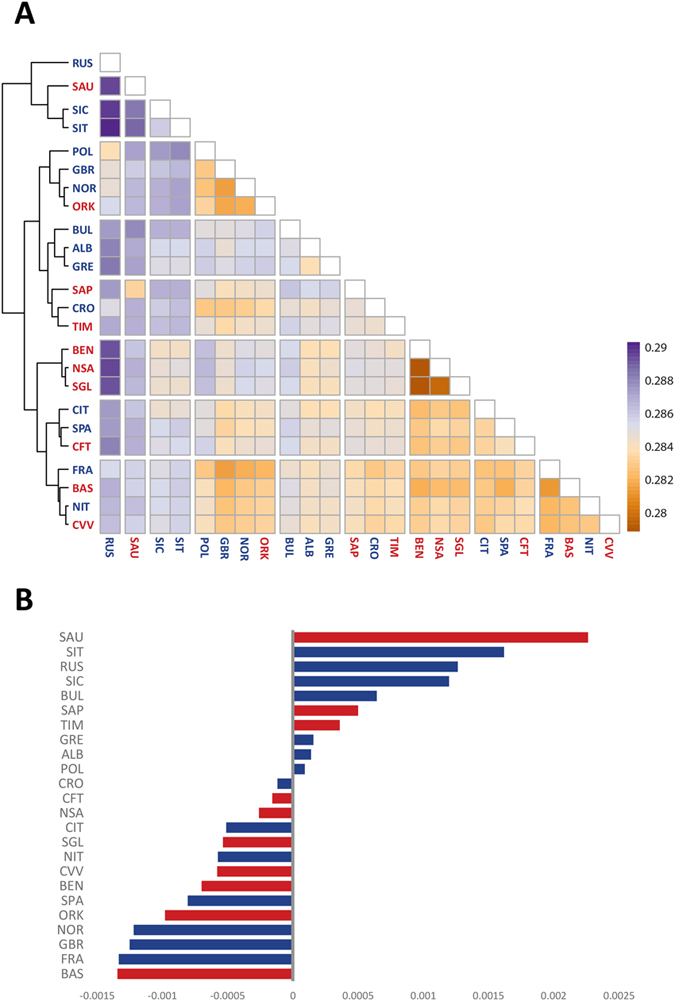
Figure 6.

(A) Heatmap of pairwise genetic distances (R package Pheatmap). Populations are clustered according to a complete hierarchical approach (B) Deviation of the average genetic distances from those predicted by an isolation by distance model in open populations (see Materials and Methods for more details).
