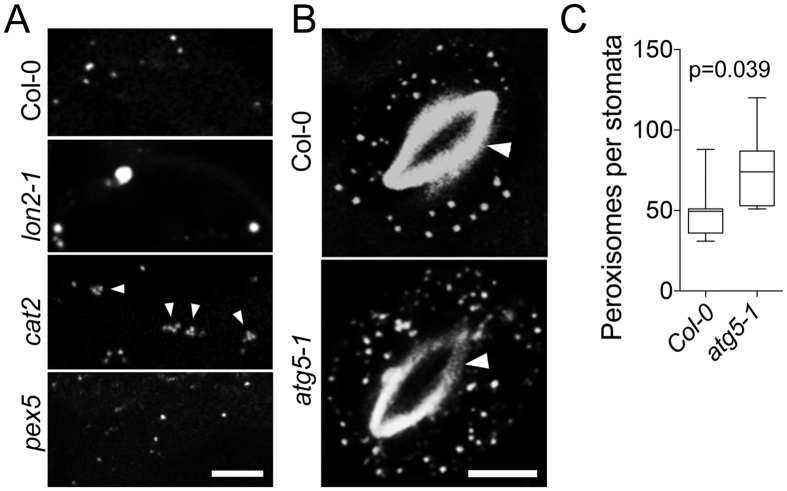
Figure 2. Staining of peroxisomes in mutants with known abnormalities of peroxisomal morphology or abundance.
(A) N-BODIPY staining of mesophyll cells of Col-0, and mutant alleles of LON protease lon2-1, catalase cat2, and peroxisomal import receptor PEROXIN5 pex5. Arrowheads denote peroxisome aggregation. Scale bar 5 μm. (B) N-BODIPY staining of stomata cells in Col-0 and autophagy mutant atg5-1. Arrowheads indicate autofluorescence of the stomata cell walls. Scale bar 5 μm. (C) Number of peroxisomes per stomata in Col-0 and atg5-1 background. Error bars show mean values of 8 biological repeats (n = 8) ± SD. p value was calculated by unpaired t-test with Welch’s correction.

