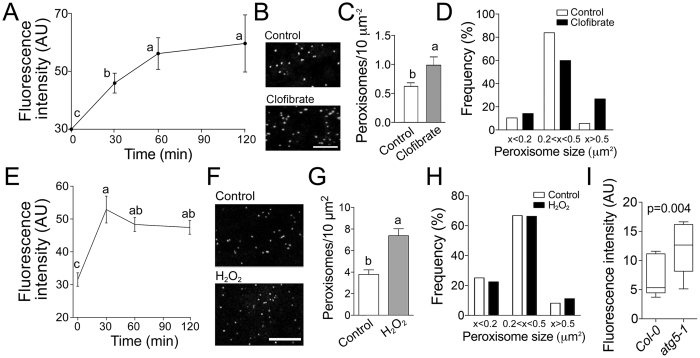
Figure 6. N-BODIPY fluorescence correlates with the number of peroxisomes in cells.
(A) Time-course of N-BODIPY fluorescence in total extracts from BY-2 cells treated with 1 mM clofibrate. (B) N-BODIPY staining of cells treated with 1 mM clofibrate for 30 min. Scale bar 10 μm. (C) Density of peroxisomes in control and cells treated with clofibrate for 30 min (number of cells analyzed N=25). (D) Frequency of peroxisomal sizes. White bars, control; black bars, clofibrate (number of peroxisomes measured N = 150). (E) Time-course of N-BODIPY fluorescence in total extracts from BY-2 cells treated with 30 mM H2O2. (F) Staining of peroxisomes in cells treated with H2O2 for 30 min. Scale bar, 10 μm. (G) Density of peroxisomes in control and cells treated with H2O2 for 30 min (number of cells analyzed N = 29). (H) Frequency of peroxisomal sizes. White bars, control; black bars, H2O2 (number of peroxisomes measured N = 400). (I) N-BODIPY fluorescence in the total extracts from leaves of Col-0 and atg5-1 plants (number of plants measured N = 5). Error bars show standard deviation. The difference between mean values denoted by the same letter is insignificant (P > 0.05, one-way ANOVA test in A and B, or t-test in C, G, and I).

