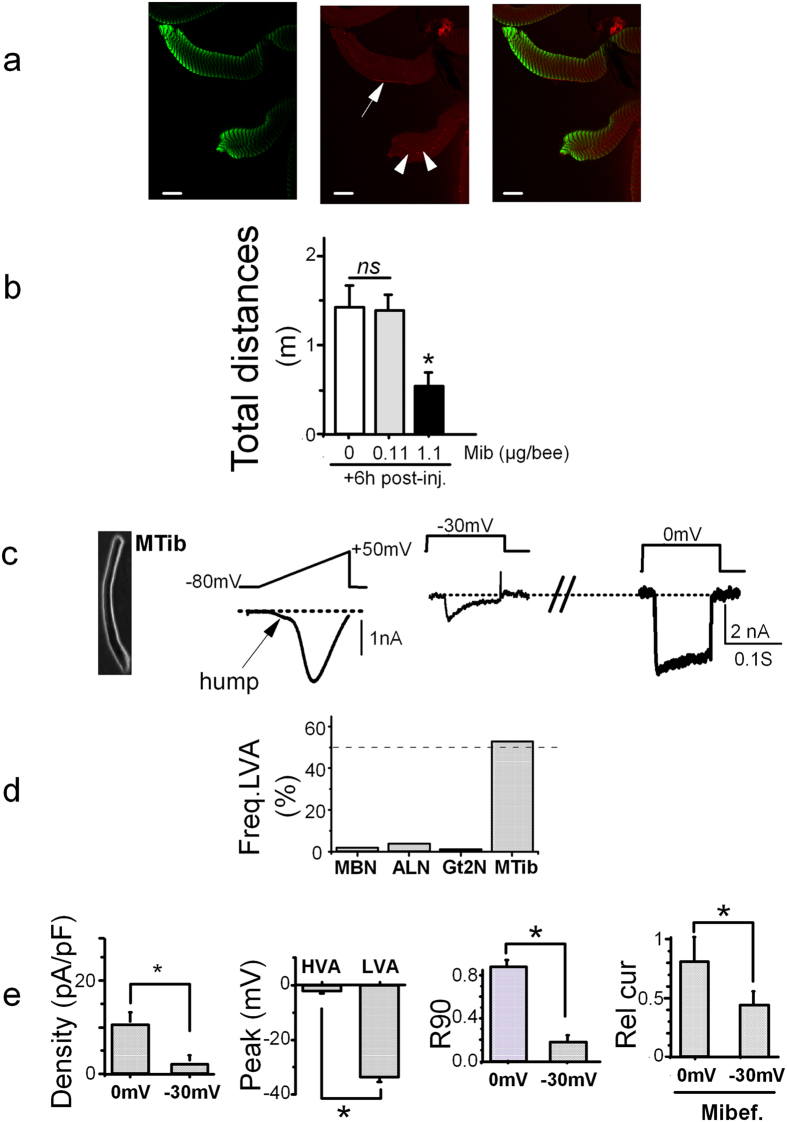
Figure 4. Muscle CaV3 Ca2+ channel and locomotion.
(a) Confocal images of isolated muscle cells stained with phalloïdin (left, green) and with Am-CaV3 specific antibody 3CT6, (middle, red). Merged staining is shown on the right. CaV3 staining is observed in bands within and between phalloïdin staining, in lines along the plasma membrane (arrow) and in isolated spots (arrowheads). The averaged distances ratio of phalloïdin staining over CaV3 staining was 1.6 ± 0.2 (n = 14). Scale bar, 30 μm. (b) Averaged walking distances covered by bees during 3 minutes in a vertical circular arena after intra-ocellar injection of 0, 0.11 or 1.1 μg/bee of mibefradil. Experiments were performed 6 h after injection (+6 h post-inj.). (c) Ba2+ currents recorded on isolated leg muscle (MTib), during voltage ramps from −80 to +80 mV (middle) or during a two-step voltage-clamp protocol with depolarizations from −100 mV to −30 mV and to 0 mV (right). Left: typical DIC (differential interference contrast) images of the muscle cell where Ba2+ currents have been recorded. The arrow indicates the presence of a hump (see text) in the IV curve at hyperpolarized potentials. (d) Proportion of cells displaying traces with LVA currents evaluated by the presence of a hump on the current-voltage curve for MBN (n = 30), ALN (n = 19), Gt2N (n = 15) and muscle cells (MTib, n = 58) (e) Left. Current density of the Ba2+ currents recorded in muscle cells at −30 mV or 0 mV ([Ba2+] = 2 mM, n = 32). Middle-right. Voltage for peak amplitude of the current-voltage curves for LVA and HVA muscle cell Ba2+ currents (n = 16 and 32). Kinetics of inactivation (Middle-left), quantified as the remaining current at 90 ms after the onset of the depolarization (R90), for Ba2+ currents recorded in muscle at −30 mV or 0 mV (n = 17). Right. Effect of mibefradil (10 μM) on Ba2+ currents recorded on muscle cells (depolarization to −30 mV or 0 mV). Rel cur: currents normalized to the current in absence of mibefradil.

