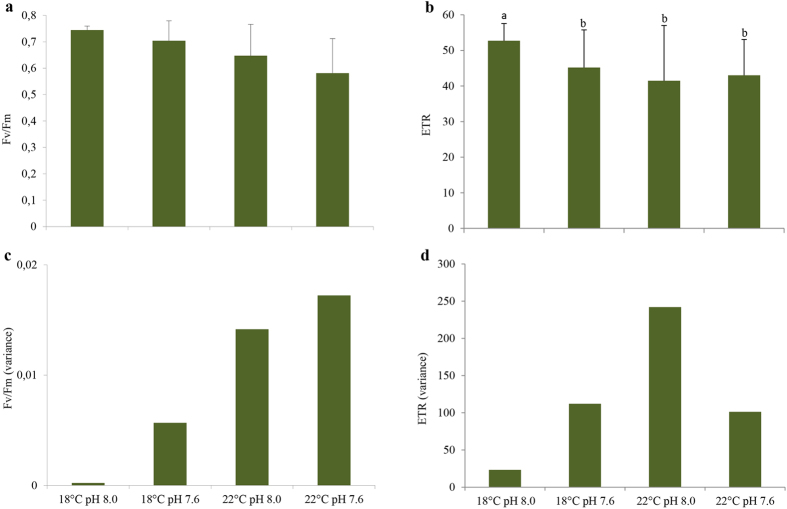
Figure 2. Impact of ocean warming (+4 °C) and acidification (ΔpH = 0.4) on Zostera noltii.
(a) Maximum PSII quantum yield (Fv/Fm); (b) electron transport rate (ETR); (c) Fv/Fm variance and (d) ETR variance among treatments. Values represent mean ± SD [(n = 40 per experimental treatment (i.e., n = 10 per replicate system (n = 4), per experimental treatment)]. Different letters represent statistical differences between temperature and pH treatments, following a significant interaction (p < 0.013).

