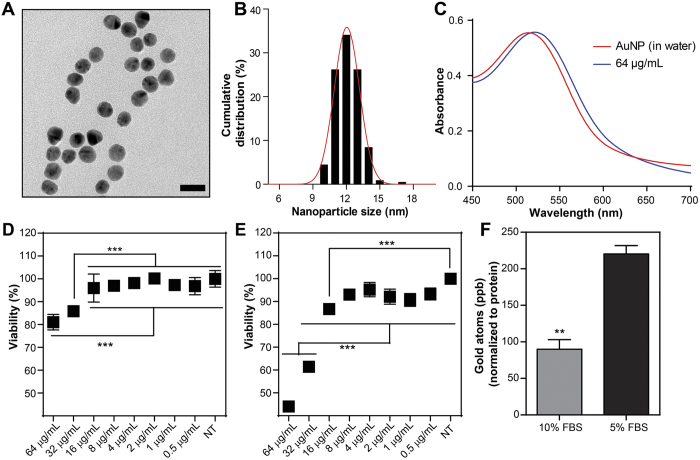
Figure 2. Characterizations, cytotoxicity, and protein corona effects on the internalization of AuNPs.
Transmission electron micrograph (Scale bar 20 nm) (A) and particle size distribution of AuNPs (B). UV-Vis spectra of AuNPs in concentrations ranging from 64 μg/mL in 5% FBS-containing media and in water (C). Dose-dependent cytotoxicity in HUVECs after 24 h of AuNPs exposure in 10% FBS DMEM (D) and 5% FBS DMEM (E) (Error bars show SEM, two independent experiments were repeated with n = 4 in 10% FBS DMEM cytotoxicity and n = 8 in 5% FBS DMEM cytotoxicity experiments. One-way ANOVA with Tukey’s Multiple Comparison Test was used to show statistical significance at ***p < 0.001 and **p < 0.01). Relative uptake of 8 μg/mL AuNPs exposed in 10% FBS DMEM and 5% FBS DMEM in HUVECs after 4 h of incubation (F) (Error bars show SEM, two independent experiments were repeated with n = 3 in each experiment. Student’s t-test was used to show statistical significance at **p < 0.01).

