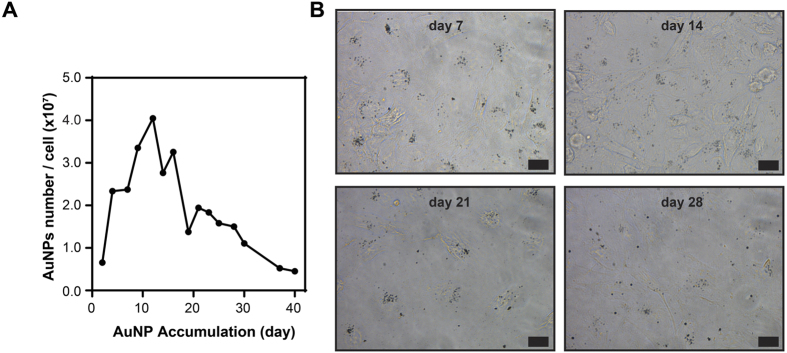
Figure 3. In vitro long-term accumulation of AuNPs in HUVECs.
The amount of internalized AuNPs in HUVECs quantified from the data measured by ICP-MS at each passage and its normalization to cell number. The number of AuNPs is expressed as AuNPs per cell (A). Silver staining of cells at different accumulation time points (days 7, 14, 21, and 28) (B). Scale bars are 20 μm.

