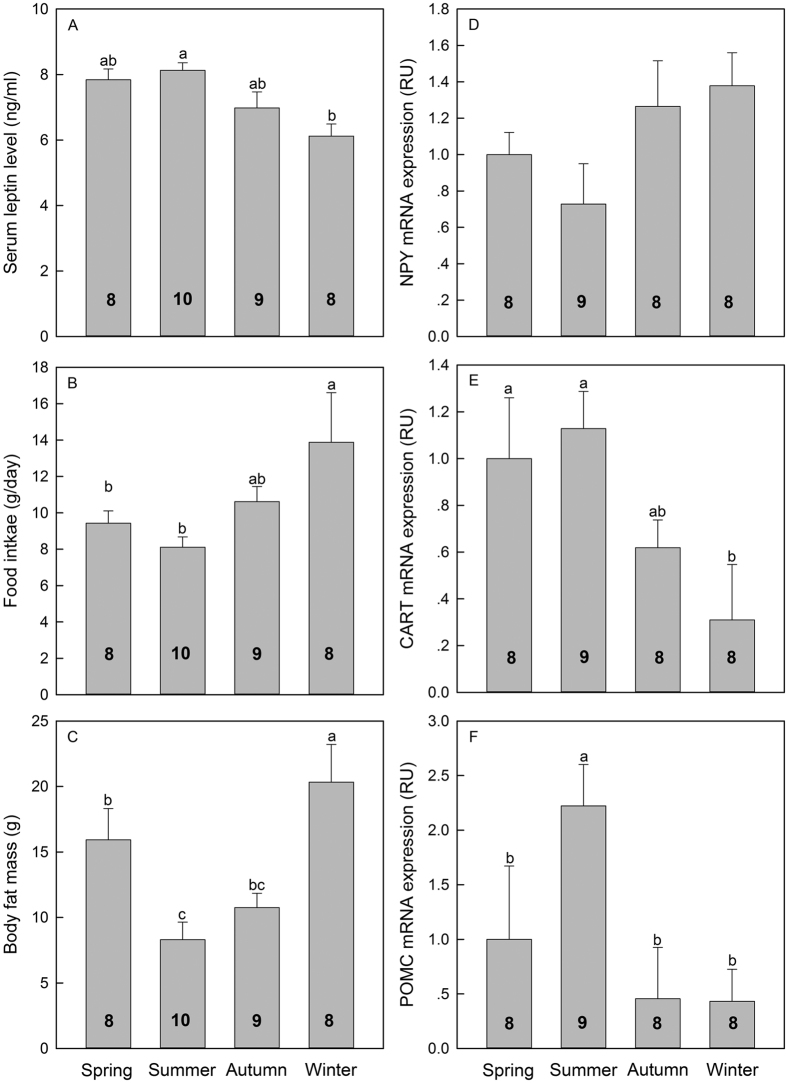
Figure 2. Seasonal variations of serum leptin levels (A), food intake (B), body fat mass (C) and hypothalamic gene ((D) NPY, neuropeptide Y; (E) CART; cocaine- and amphetamine-regulated transcript; (F) POMC, pro-opio-melanocortin) expression of tree shrews.
Results are presented as mean ± SME. Means with different letters differ significantly (Tukey’s post hoc test, α = 0.05; a > b > c). Numbers inside bars indicate sample size for each season.

