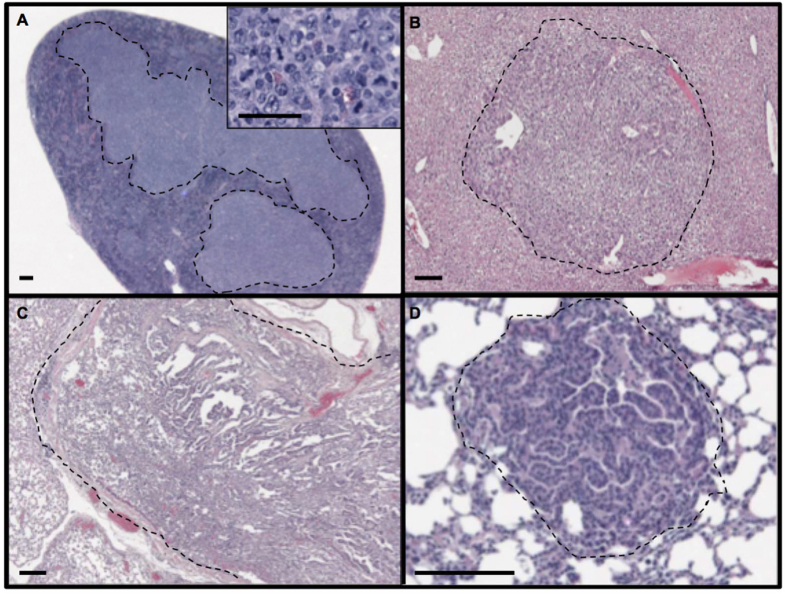
Figure 8. Representative examples of neoplastic tumors in aged Grp78+/+ and Grp78+/− mice.
(A) Section of spleen from a Grp78+/+ mouse showing extensive infiltration by a lymphoma outlined by the dashed lines; the inset shows a magnified representative section of the tumor, illustrating a monoclonal population of cells with pleomorphic nuclei and a high mitotic rate. (B) Section of liver from a Grp78+/− mouse showing an adenoma outlined by the dashed line. Sections of lung from Grp78+/+ (C) and Grp78+/− (D) mice. In each case the pulmonary parenchyma is infiltrated by an adenocarcinoma, which is extensive in (C) and microscopic in (D). Both tumors show papillary architecture. Tumors in panels A and D are from C57BL/6 mice while those in panels B and C are from C57BL/6*129sv mice. Magnification bars: 50 microns in A, 100 microns in (B–D).

