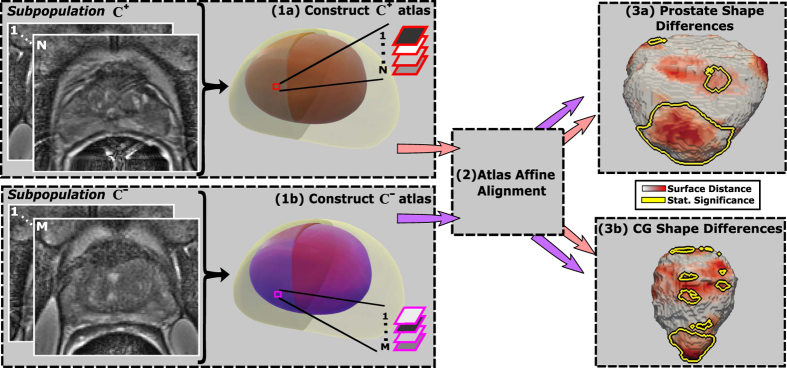
Figure 6.
Framework for atlas comparison for two subpopulations, C+ and C−; (1) Statistical shape atlases are constructed for (a) C+ and (b) C− for the entire prostate (grey, purple) and CG (red, purple); (2) The C+ and C− atlases are aligned to a common space; (3) per-voxel statistical comparisons are performed to assess shape differences on the prostate boundary and CG.

