
Figure 1. Mean rate of tissue loss (percent per day) in Acropora intermedia corals exposed to varying levels of ocean acidification and coral-macroalgal competition treatments.
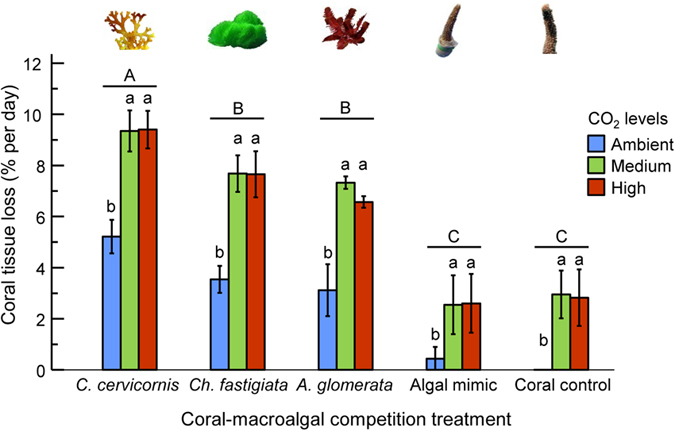
The rate was calculated by estimating the amount of coral tissue loss per day and values were then averaged by the number of days until complete loss of coral tissue. N = 12 coral branches (±SEM). Corals were exposed to contact with the macroalgae Canistrocarpus (=Dictyota) cervicornis, Chlorodesmis fastigiata, Amansia glomerata or a plastic mimic under three levels of CO2: ambient (380 ppm); medium (540 ppm) or high (936 ppm). Controls were corals without macroalgal contact. Data were analysed with a two-way ANOVA. Lowercase (a,b) and uppercase (A,B,C) letters indicate significant differences among CO2 and competition treatments, respectively, via Tukey tests. Complete ANOVA and Tukey test results are in Table 1.