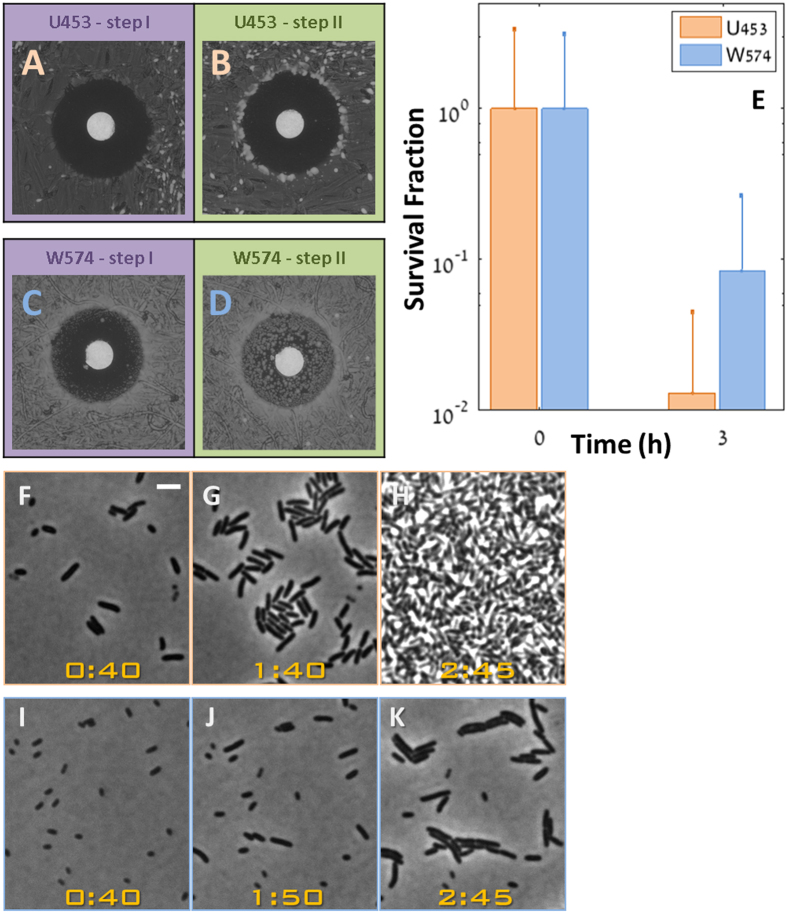
Figure 5. TDtest reveals different tolerance levels in clinical isolates exposed to the same antibiotic.
TDtest for E. coli strains U453 (A,B) and W574 (C,D) with ertapenem (0.25 μg). (A) U453 after standard exposure to ertapenem disk. (B) U453 at the end of TDtest. The absence of colonies inside the inhibition zone indicate that this strain has a low tolerance level (C) W574 after standard exposure to ertapenem disk. (D) W574 at the end of TDtest. The high number of microcolonies growing inside the inhibition zone indicates that this strain has a high tolerance level. (E) Survival fraction of W574 (Blue) and U453 (orange) under ertapenem (10 μg/ml) showing the slower killing of the W574 tolerant strains. (F–K) Time-lapse microscopy of the strains shown in (A–E) without antibiotics, reveals that the tolerance is due to an extended lag phase of the high tolerance strain: (F–H) U453. (I–K) W574. At t = 40 min, the short lag strain (W453) has already started to grow. Therefore the bacteria are bigger. (Bar: 3 μm, Time: hours:min).

