
Figure 4. The effect of natural light on the expression of MzASMT9 gene in apple leaves and its correlation with MDA and melatonin concentrations in 24 light/dark cycle.
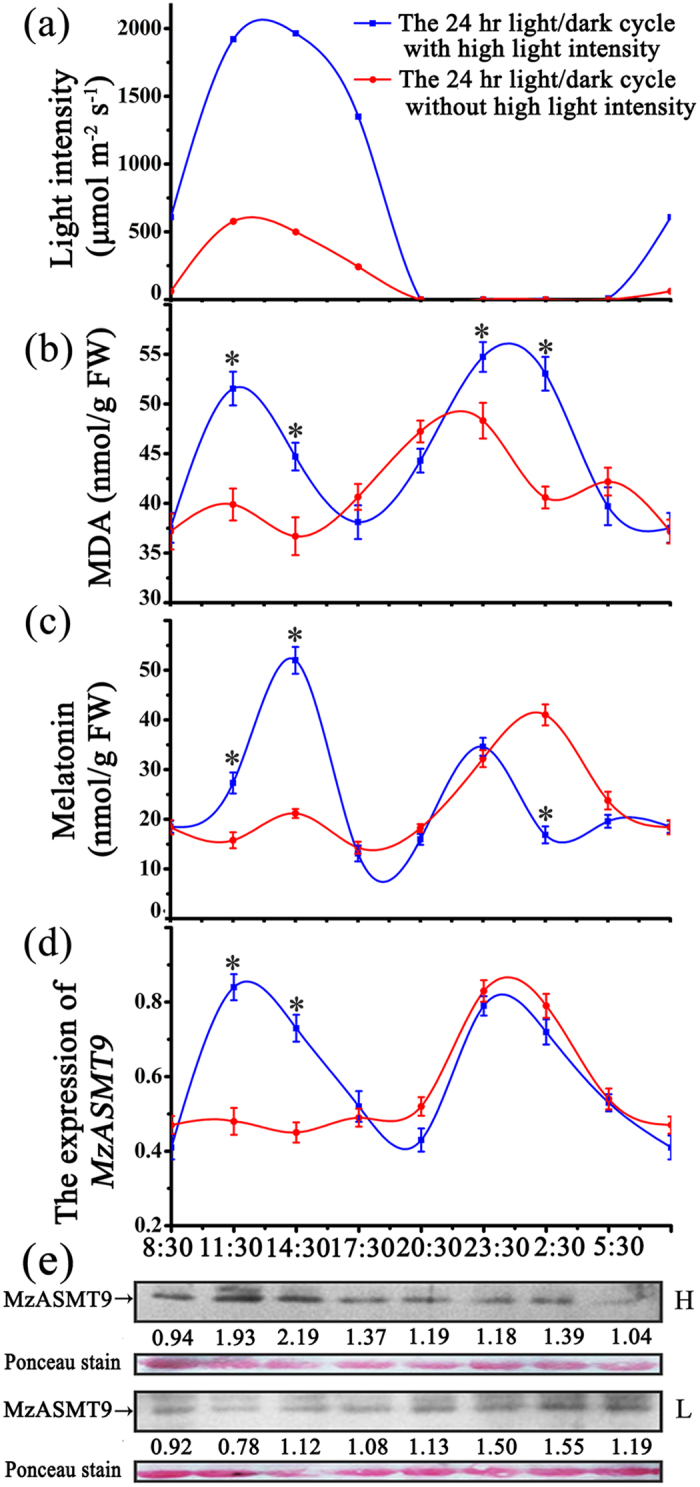
(a) The record of light intensities from 8:30, 17th July 2015 to 5:30, 18th July 2015 and 4th August 2015 to 5th August 2015 at the sampling times. (b) and (c) The levels of MDA and melatonin in 24 light/dark cycle. (d) and (e) The expression profiles of MzASMT9 gene and MzASMT9 protein of apple leaves in 24 h light/dark cycle with high intensity of light (labeled with H) and low intensity of light (labeled with L). The arrows indicate the MzASMT9 protein.