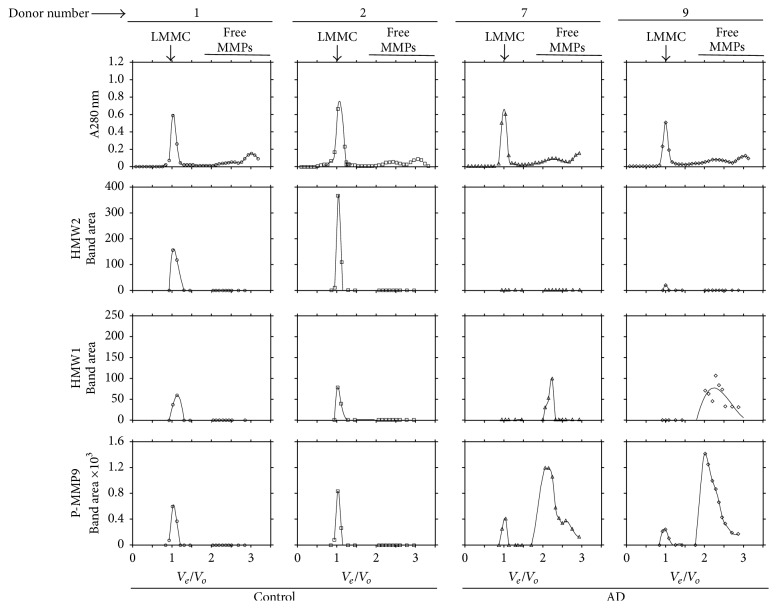
Figure 5.
Densitometric quantification of MMP species following gel filtration and zymography. Scans were obtained from the zymograms in Figure 4 and are plotted as level of MMP species versus normalised elution volume (ve/vo). In the control plots, MMP species present were associated with the LMMC complex without any detectable amounts of free species. The AD plots were dominated by the copious presence of free HMW1 and pro-MMP9 species. Free HMW2 was not detected in any of the samples examined. Note the nearly 6-fold higher vertical scale in the pro-MMP9 plot compared to the HMW1 plot.

