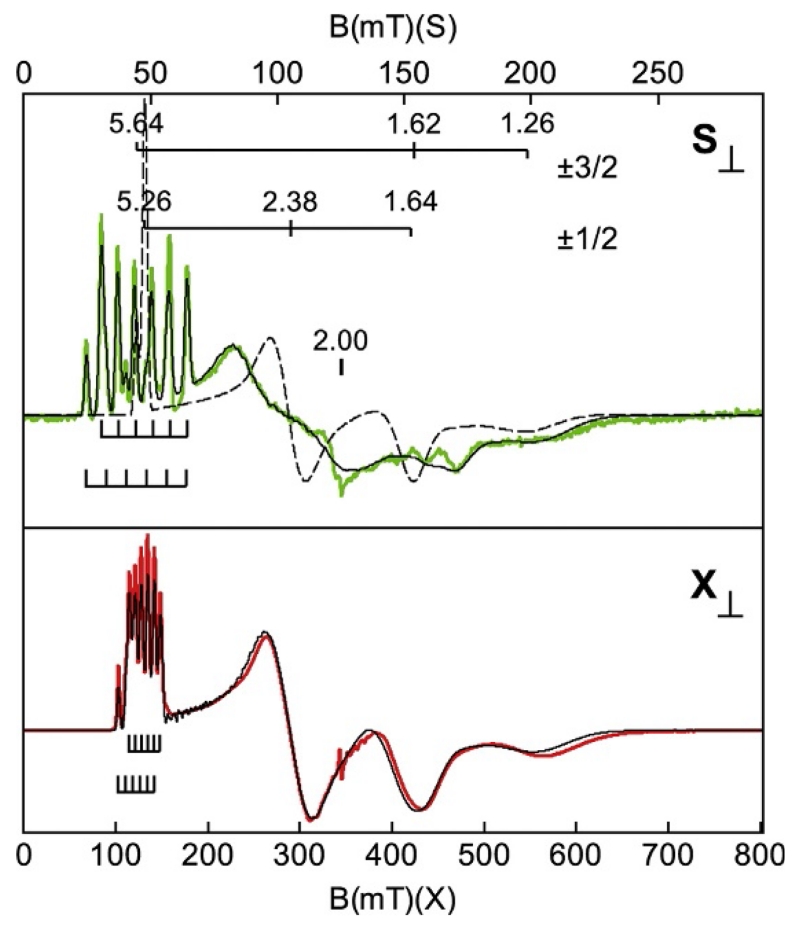
Figure 13.
S- and X-band EPR spectra (colored traces) and simulations (black traces) of [MnIVH3buea(O)]− in DMF/THF. The magnetic field ranges are plotted for equal g-scale across microwave frequency. A minor impurity occurs near g=2.00 in both spectra. Experimental conditions: Temperature 12 K; frequency 3.500 GHz (S) and 9.642 GHz (X); and power 0.03 mW (S), 0.20 mW (X). Simulations: S=3/2, D=+2.5 cm−1, E/D=0.256, σE/D=0.024, g=(2.01, 1.99, 1.99), A=(165, 188, 244) MHz, A-tensor rotated relative to D-tensor by 36° about the y-axis.

