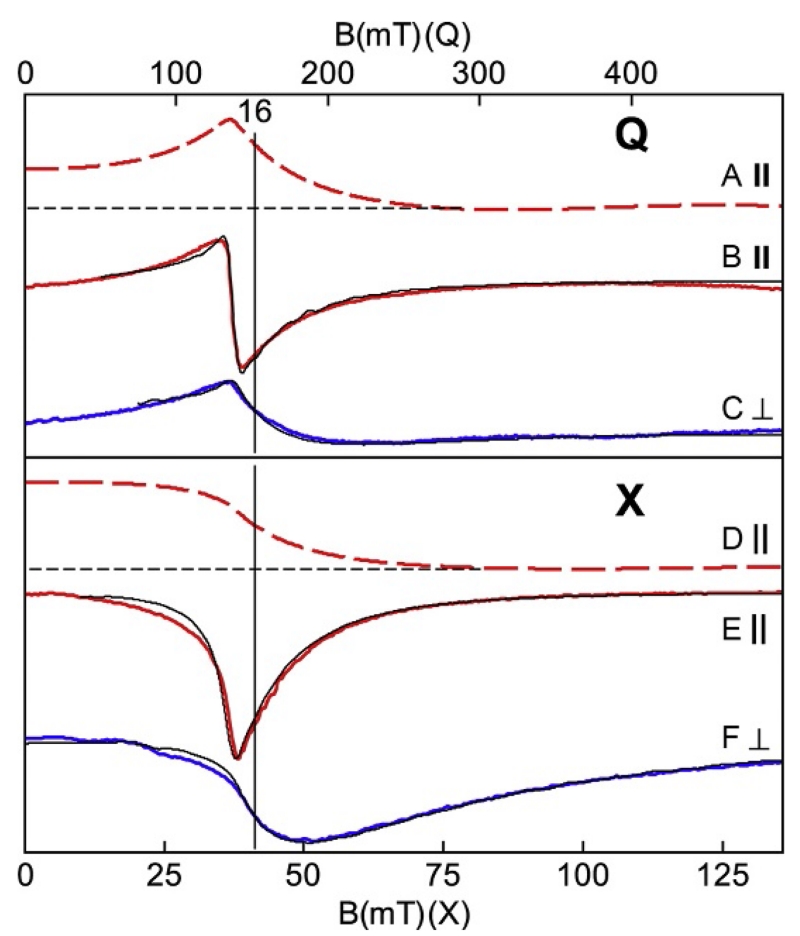
Figure 16.
X- (lower) and Q-band (upper) EPR spectra (colored traces) and simulations (black traces) of the azide complex of hemerythrin, pH 6.0. The red (gray in the print version) traces are for B1∥B and the blue (dark gray in the print version) traces are for B1⊥B. The absorption spectra (A, D) are integrations of (B, E) demonstrating presence of signal intensity at zero field. The magnetic field ranges are plotted for equal g-scale across microwave frequency. Simulations: S=4, D=2.9 cm−1, E/D=0.165, σE/D=0.11, gy=2.25. Experimental conditions: temperature, 10 K; microwaves, 2 mW at 34.073 GHz (B, C), 0.2 mW at 9.253 GHz (E), and 0.02 mW at 9.620 GHz (F).

