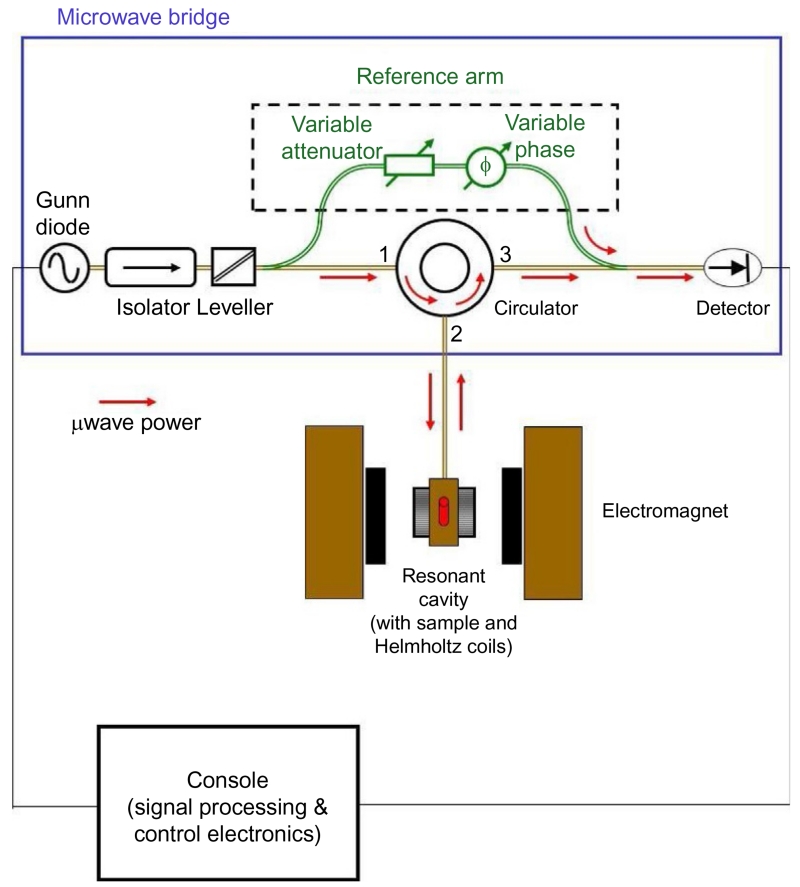
Figure 4.
Schematic diagram of the EPR spectrometer. The microwave radiation is produced by a Gunn diode with a small amount diverted through the bypass arm to the detector. The remaining radiation travels down a series of waveguides, an isolator (protects source from reflected microwave power), and a leveler (controls the microwave power) through a circulator to the sample in the resonant cavity (red (gray in the print version) arrows). When the instrument is properly tuned, no microwave power is reflected back from the cavity. When the magnetic field is swept through resonance, microwave power is absorbed by the sample in the cavity and a small signal is reflected back from the cavity that travels through the circulator and is mixed with the signal from the bypass arm. The combined signal then travels to the detector and the electronics console for processing.

