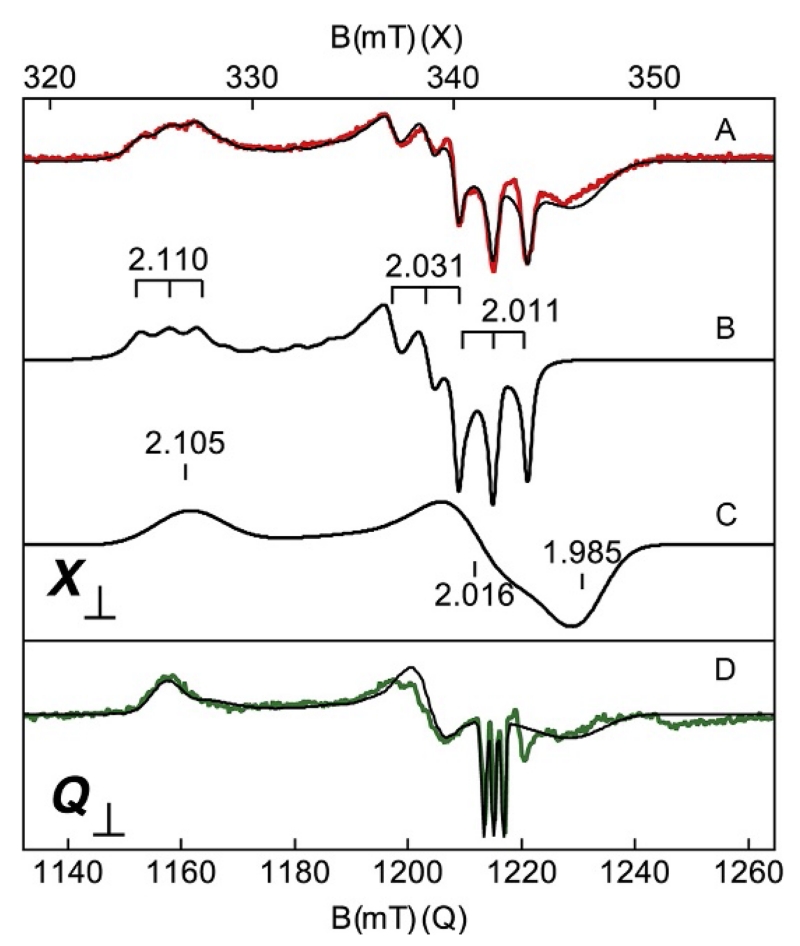
Figure 7.
(A) X- and (D) Q-band EPR spectra (colored traces) and simulations (black traces) of the NO adduct of Tryptophan dioxygenase (Gupta, Fu, Liu, & Hendrich, 2010). (B, C) The simulations of the two heme species. (A, D) Simulation sums of the two species at equal concentrations. The magnetic field ranges are plotted for equal g-scale across microwave frequency. Experimental conditions: microwaves, 0.02 mW at 9.625 GHz (X) and 0.005 mW at 34.197 GHz (Q); temperature, 20 K (X) and 27 K (Q). The weak signal near g=1.96 is due to a minor amount of free NO in solution. The g-tensors of the simulations are listed on the figure. The 14N (I=1) A-tensor for (B) is 48, 49, and 39 MHz or 1.6, 1.6, and 1.5 mT.

