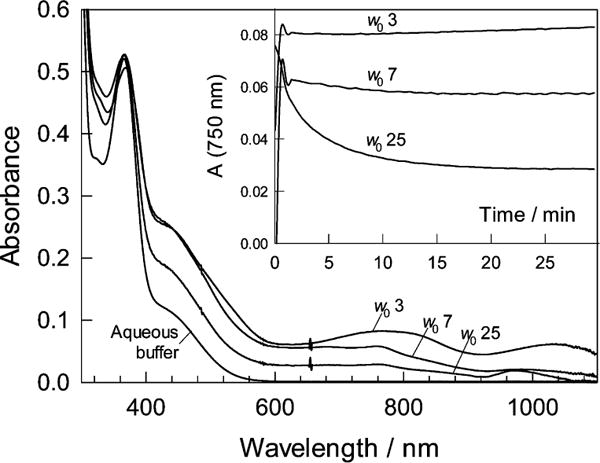
Figure 2.

Spectra of 1a in the AOT reverse micelles in n-octane recorded 20 min after mixing all components. The spectrum of 1a in the aqueous buffer (bottom) is shown for comparison. Conditions: [1a] 1.36 × 10⁻⁴ M, pH 8, w0 = 3, 7, and 25; 25 °C. Inset shows changes of absorbance at 750 nm with time for the three different values of w0.
