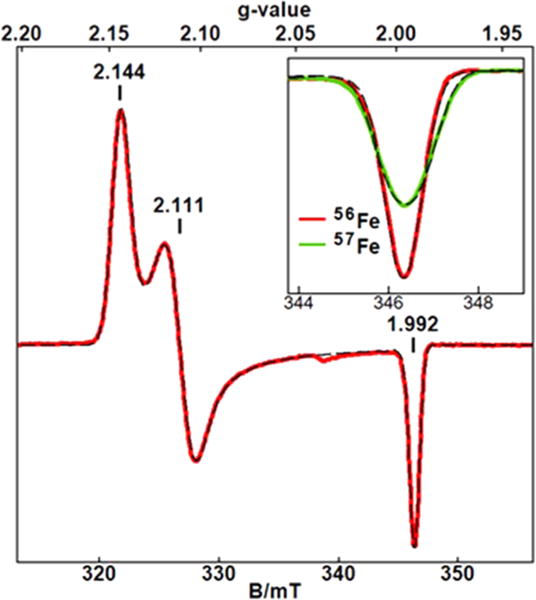
Figure 4.

EPR spectra (red and green) of 3a under the same conditions as in Figure 3D. The inset shows an expanded view at g = 1.992 for 56Fe and enriched 57Fe samples. The dashed lines are S = 1/2 simulations with and without inclusion of a hyperfine term for I = 1/2 with A = 18 MHz.
