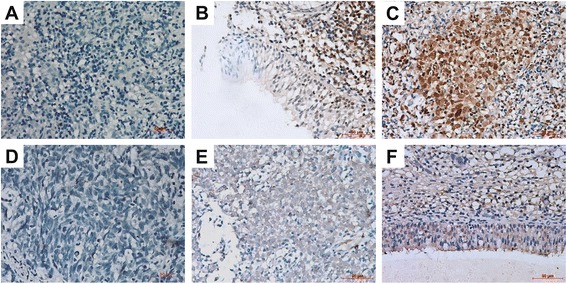
Fig. 3.

Expression analysis of IGFBP-1 and IGF-1 in NPC by immunohistochemistry. NPC slides were process for immunohistochemistry of IGFBP-1 and IGF-1 and the following observations were made: a-g. (×200). a Negative stain of IGFBP-1 in NPC tissues. b Low expression level of IGFBP-1 in adjacent non-tumourous tissue. c High expression level of IGFBP-1 in NPC tissues. d Negative stain of IGF-1 in NPC tissues. e Low expression of IGF-1 in NPC tissues. f High expression of IGF-1 in adjacent non-tumourous tissue. Bar, 50 μm
