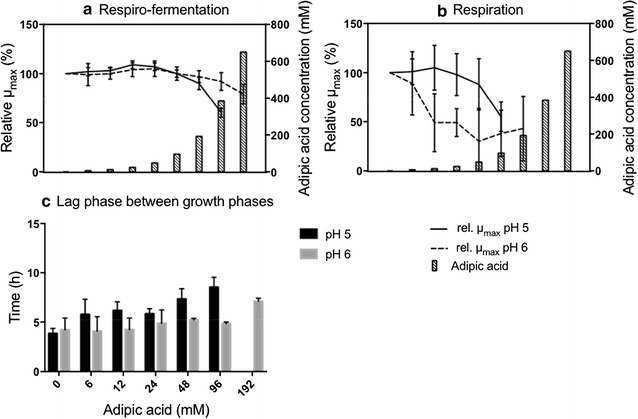
Fig. 3.

Effect of adipic acid on the growth kinetics of S. cerevisiae Ethanol Red. Relative µmax during respiro-fermentative growth (a) and respiratory growth (b). Lag phase between the respiro-fermentative and the respiratory growth phase (c). The results in A and B are expressed as relative µmax, corrected for the effect of osmotic pressure, to the µmax of cells grown without adipic acid. The concentrations of adipic acid are: 0, 6, 12, 24, 48, 96, 192, 384 and 650 mM. All results are given as the mean ± standard deviation from ten replicates
