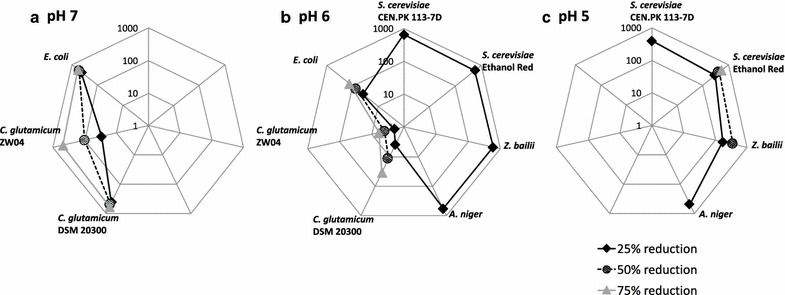
Fig. 7.

Comparing the effect of adipic acid and pH on the relative µmax for all the microorganisms included in this study. Data points are estimated concentration of adipic acid required to reduce µmax by 25, 50 and 75% for bacteria at pH 7 (a), yeasts, A. niger and bacteria at pH 6 (b), and yeasts and A. niger at pH 5 (c). The axes on the radar plots are logarithmic base 10. C. viswanathii is not included since a 25% reduction in µmax was not observed at any adipic acid concentration at any pH tested. The values given are obtained from five to ten replicates
