
Fig. 6.
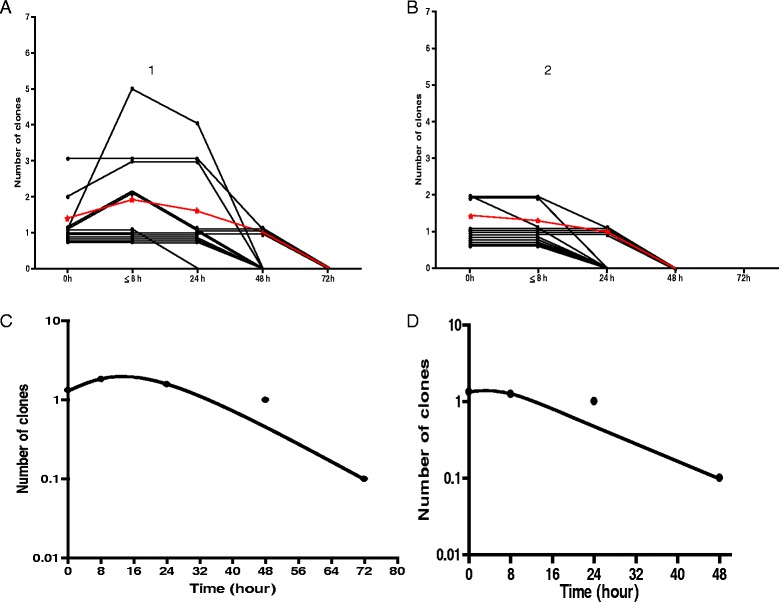
Time-course of changes in parasite DNA clones in age-, gender-, parasitaemia- and treatment-matched children with [1] and without [2] early rising asexual parasitaemia following artemisinin-based combination treatment. Panel a shows individual (black lines) and mean (red line) of area under curves (AUC of clone number versus time) in children with ERAP. Panel b shows individual (black lines) and mean (red line) of area under curves (AUC of clone number versus time) in children without ERAP. Panels c and d show semilog plots of mean clone number versus time in children with and without ERAP, respectively. Declines from peak clone number were monoexponential (mean estimated half-times were 3.4 h (95% CI 3.1–3.7) and 3.1 h (95% CI 2.7–3.4), respectively)