
Fig. 4.
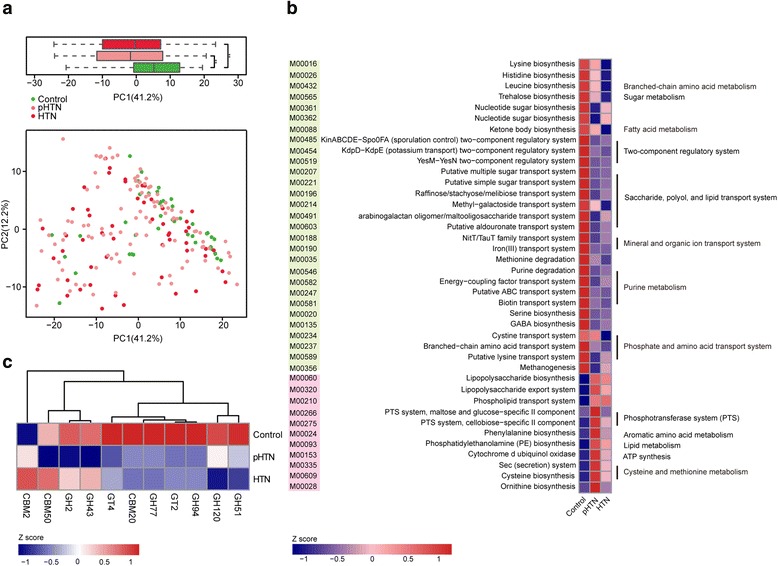
Microbial gene functions annotation in pHTN and HTN. a PCA based on the relative abundance of KEGG orthology groups in 196 samples. Significant differences across groups are established at the first principal component (PC1) values, and shown in the box plots above. **P value <0.001, Wilcoxon rank sum test. b The average abundance of KEGG modules differentially enriched in control, pHTN, and HTN gut microbiome. Twenty nine modules enriched in control, and 11 modules overrepresented in both pHTN and HTN are shown in green and pink, respectively. The functional potential of KEGG modules are demonstrated on the right. c Heat map showing the abundance of 11 most significantly altered CAZy family in pHTN or HTN as compared to control