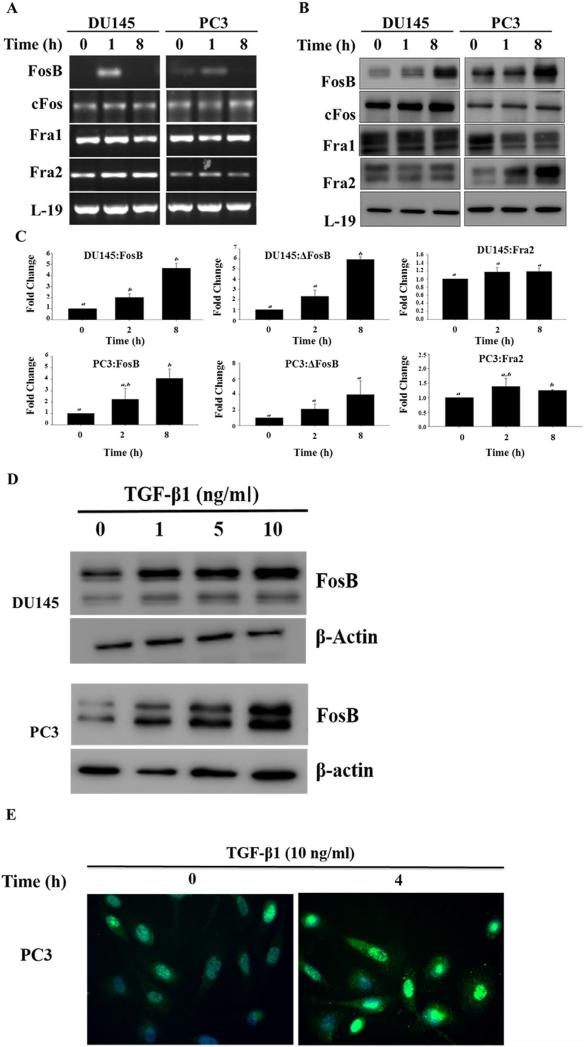
Fig. 2.
TGF-β1 effects on expression of FOS family members. (A) RT-PCR analysis of FosB, cFos, Fra1, and Fra2 mRNA levels in DU145 and PC3 prostate cancer cells after exposure to exogenous TGF-β (10 ng/ml) for different times. (B) Western blot analysis of FosB, the FosB antibody used recognizes both full length FosB (higher molecular weight band) and ΔFosB (lower molecular weight band), cFos, Fra1, and Fra2 protein levels DU145 and PC3 prostate cancer cells after exposure to exogenous TGF-β1 (10 ng/ml) for different times. (C) Band density analysis of FosB and Fra2 in DU145 and PC3 cells after treatment with TGF-β1 for 2 and 8 hr. Each band density was normalized by density of β-actin bands. Each bar represents the Mean ± SD from three independent experiments. “a and b” denote significant differences (P < 0.05) from untreated controls. (D) The Dose dependent effects of TGF-β1 on expression of FosB; Western blot analysis of FosB in prostate cancer cells DU145 and PC3 after treatment with varying concentrations of exogenous TGF-β1 (0, 1, 5, 10 ng/ml) for 4 hr. (E) Immunofluorescence, TGF-β1 activation of FosB in PC3. Cells were treated with exogenous TGF-β1 (10 ng/ml) for 0 and 4 hr.

