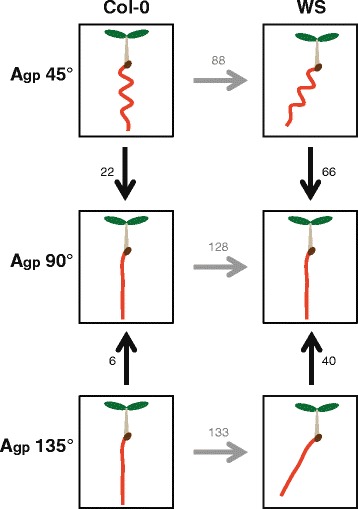
Fig. 1.

Various comparisons of microarray data reveals different genes involved in root skewing and waving. Arrows point to control used in each experiment. Vertical arrows indicate comparisons within ecotypes, horizontal arrows indicate comparisons between ecotypes. Eight-day experiment designed to isolate each permutation of root skewing and root waving and identify genes responsible. Vertical comparisons reveal genes responsible for changing the root growth pattern in response to different Agp – for WS, these genes correlate to skewing and waving phenotypes. Horizontal comparisons reveal genes responsible for differences in skewing and waving for Col-0 and WS roots. Numbers indicate gene transcripts with different levels of transcripts from controls. Significance cutoffs of |log2(FC)| > 1, p < 0.05
