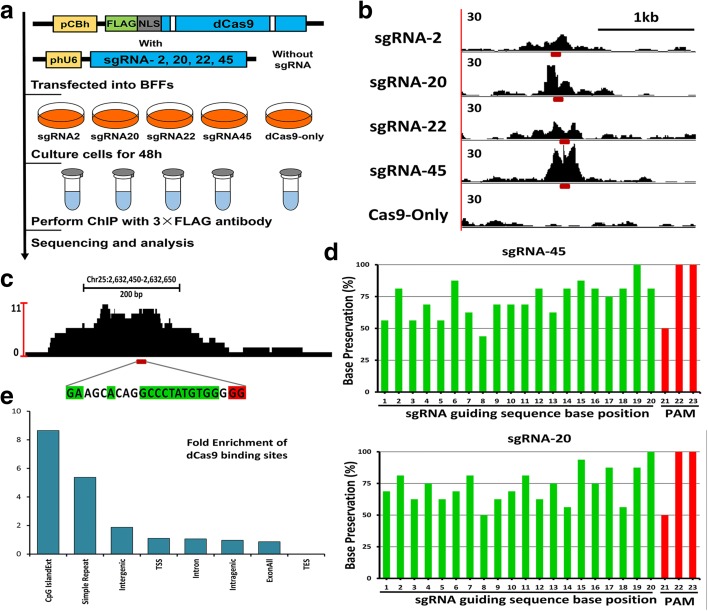
Fig. 2.
Process and characteristics of dCas9 binding in BFFs. a Schematic representation of the dCas9 ChIP-seq approach applied to the BFFs. The four 3 × FLAG-tagged Cas9-encoding plasmids with different sgRNAs were considered different experimental groups (left) and the same plasmid but without sgRNA was used for the dCas9-only control (right). b Visualization of the ChIP-seq peaks (normalized read counts) revealed that they were localized around four on-target sites and the control. The red dashes under each peak indicate the designed target sites. c Visualization of the ChIP-seq peak of one typical off-target region. The location of this region is shown above the peak. Bases matching the sgRNA guiding sequences and PAM sequences at the off-target sites are highlighted in green and red, respectively. d Percentages of preserved bases at the main off-target sites compared with the guiding sequences of sgRNA45 (above) and sgRNA 20 (below). e Performance of dCas9 in binding to the chromatin structure of the off-target binding site. “TSS” represents the 1 kb region centered on the transcription start site region; “TES” represents the same range of the transcription end site

