Fig. 7.
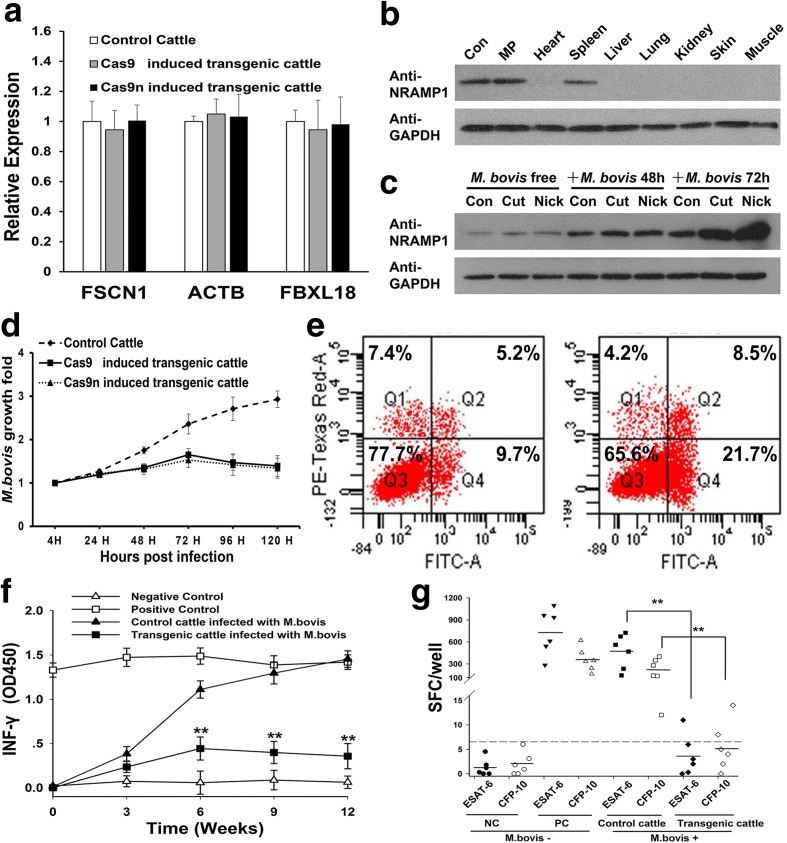
Assessment of the increased resistance of the transgenic cattle to tuberculosis. a The relative expression levels of the nearby endogenous genes in the F-A locus. Each sample was individually detected in macrophages through real-time PCR, but the data were analyzed according to the group. b The expression of NRAMP1 was restricted to dedicated phagocytes. The organs were obtained from a pool of dead transgenic cattle. Con, NRAMP1 over-expression Raw264.7 cells; MP macrophages. c The expression of NRAMP1 was highly activated in the transgenic cattle following infection. All the samples were mixed monocyte-derived macrophages (MDMs) that were isolated from the blood of the same group of cattle as a pool. “Con” represents the control normal cattle. d Multiplication of M. bovis in MDMs from the control or transgenic cattle in vitro. The MDMs were separated from each animal individually and mixed according to group. M. bovis multiplication was determined via cfu assays. e Flow cytometry analysis of the cell death mechanism of the transgenic cattle MDMs after M. bovis infection. Necrotic (Q1), early apoptotic (Q2), and late apoptotic (Q4). Left, infected experiment control MDMs. Right, infected transgenic MDMs. f Amounts of IFN-γ produced in the experimental control (n = 6) and transgenic (n = 6) cattle at regular intervals of 12 weeks. g Concentrations of ESAT-6 and CFP-10 IFN-γ–producing SFCs among the PBMCs of the control and transgenic cattle

