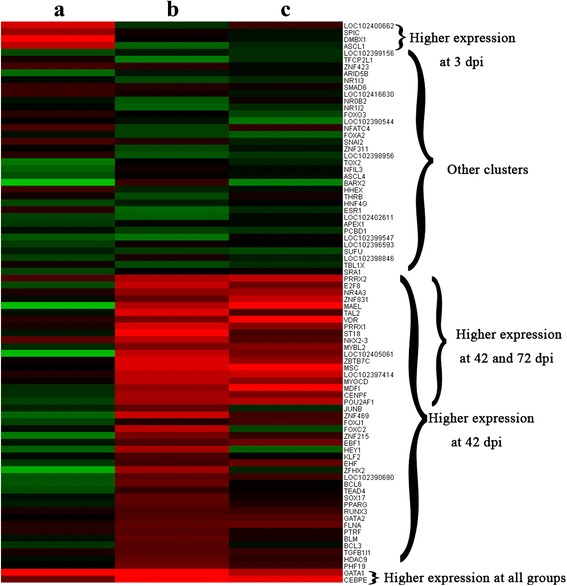
Fig. 6.

Heatmap of the differentially expressed (DE) transcription factors. a, b and c are differentially expressed transcription factors at 3, 42 and 70 dpi, respectively. The red (up) and green (down) dots represent the significantly differential expressed transcripts; the black represents the transcripts whose expression levels did not reach statistical significance
