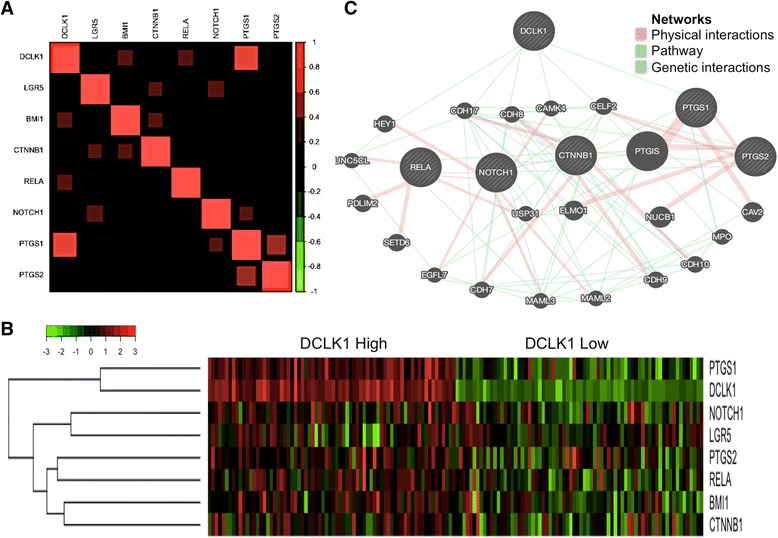
Fig. 1.

DCLK1 expression is positively correlated with genes of pro-survival signaling pathways and tumor stem cell markers. a Color indicates correlation of DCLK1 and other genes: 1) negative (green), and 2) positive (red). b Heatmap of pro-survival signaling pathways and tumor stem cell markers gene expression levels by dividing colon cancer patients into two groups based on DCLK1 expression levels from TCGA. Patients with the top 25% or bottom 25% DCLK1 expression levels were considered DCLK1-high or DCLK1-low, respectively. c A gene network from GeneMANIA shows the relationships for genes from the list (nodes) connected (with edges) according to the functional association networks from the databases. Based on the physical interactions, pathway, and genetic interactions, in the network representation, all the nodes are connected and related to DCLK1
