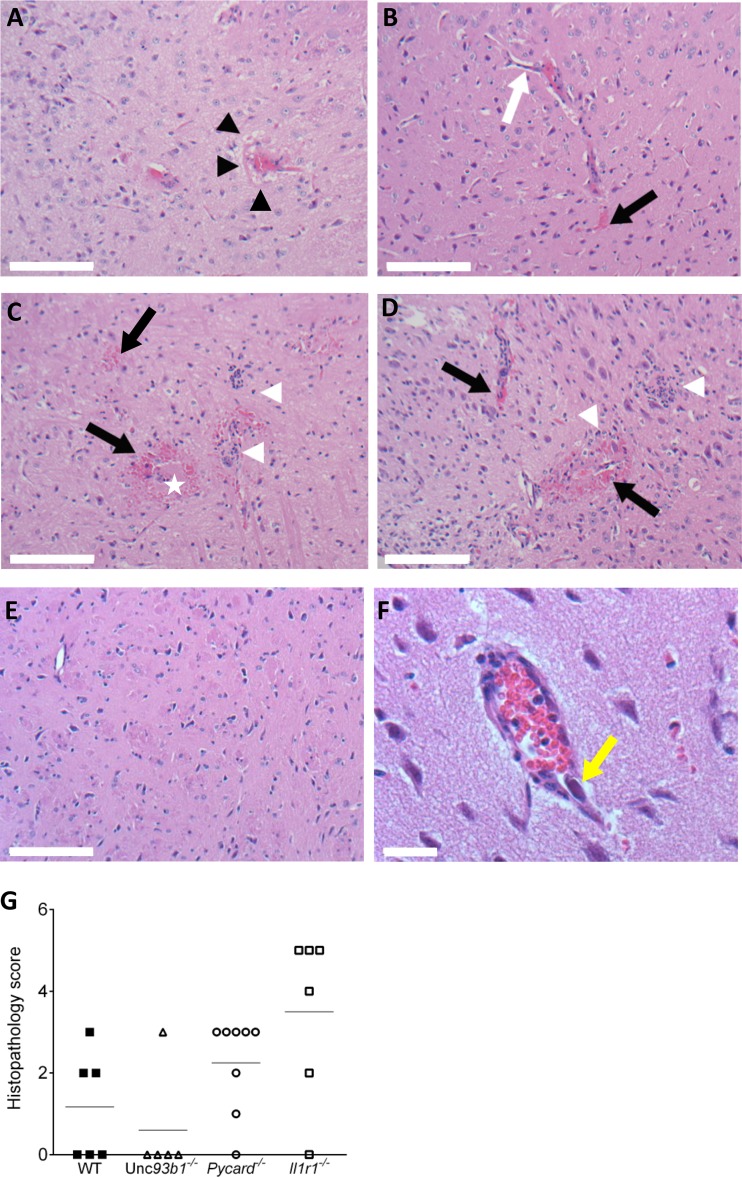
FIG 4.
Representative images of hematoxylin/eosin-stained slides from the midbrains of WT, Pycard−/−, Unc93b1−/−, and Il-1r1−/− mice infected with MAV-1 and histological scores of brain damage. Brain sections are from mice infected with 103 PFU and euthanized at 8 dpi. (A) A Unc93b1−/− mouse shows mild diffuse perivascular edema (black arrowheads). (B) A WT (C57BL/6J) mouse shows mildly hypertrophic endothelial cells (white arrow) and leakage of red blood cells and fluid into the perivascular parenchyma (black arrow). (C) A Pycard−/− mouse shows destruction of vascular integrity with loss of endothelial cells and scattered microhemorrhages (black arrow), fibrin (white star), and clusters of neutrophils in the parenchyma (white arrowheads). (D) A Il1r1−/− mouse shows marked vasculitis with loss of vascular tunics, perivascular hemorrhages (black arrows), and clusters of neutrophils, macrophages, and few lymphocytes in the parenchyma (white arrowheads). (E) Mock infected Il1r1−/− mouse. (F) Image (×400) of an Il1r1−/− mouse shows a blood vessel with a large intranuclear viral inclusion body in an endothelial cell (yellow arrow). Scale bars: A to E, 100 μm; F, 20 μm. (G) Histological scores of brain damage for WT, Pycard−/−, Unc93b1−/−, and Il1r1−/− mice. Data points represent individual mice, and the horizontal lines indicate arithmetic mean values.

