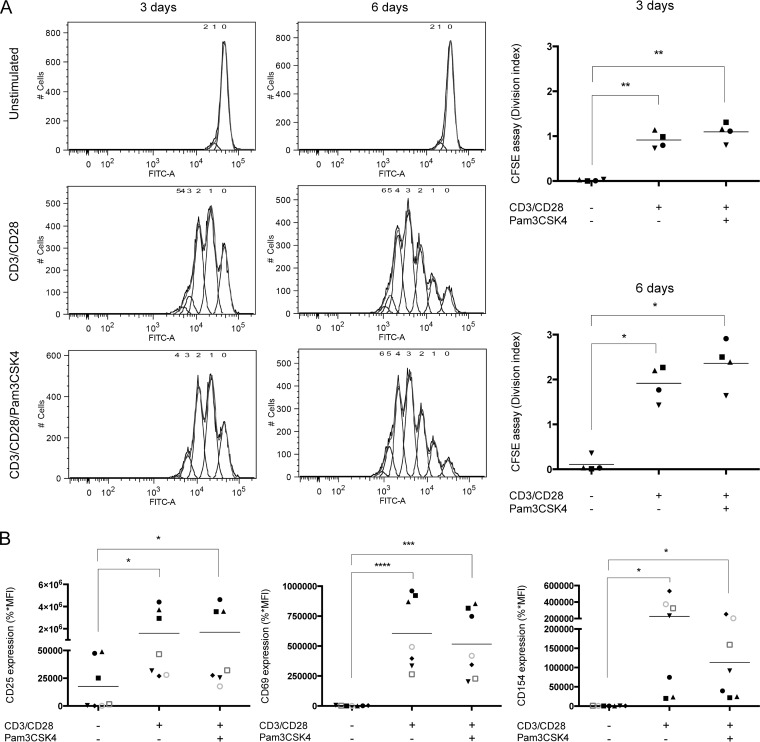
FIG 2.
TLR2 ligation does not modulate proliferation and activation profiles in CD3/CD28-costimulated CD4+ T cells. Purified primary human CD4+ T cells were treated as indicated in the legend to Fig. 1. (A) A CFSE-based dilution assay was performed by flow cytometry to evaluate cell proliferation (as expressed by a division index) following 72 h and 6 days of stimulation. Representative proliferation profiles are depicted in the panels on the left, whereas division indices are shown in the panels on the right. (B) Surface expression of activation markers CD25, CD69, and CD154 was evaluated by flow cytometry following 72 h of stimulation (%*MFI, percentage of positive cells × mean fluorescence intensity). The data shown were obtained from CD4+ T cell preparations isolated from the peripheral blood of four (A) or seven (B) healthy participants. Each symbol represents a different donor, and the horizontal line depicts the means for all donors tested. Statistical analyses were made using ratio paired t test and one-way ANOVA, followed by a Dunnett's multiple-comparison test. Asterisks denote statistically significant data (*, P ≤ 0.05; **, P ≤ 0.01; ***, P ≤ 0.001; ****, P ≤ 0.0001).

