FIG 4.
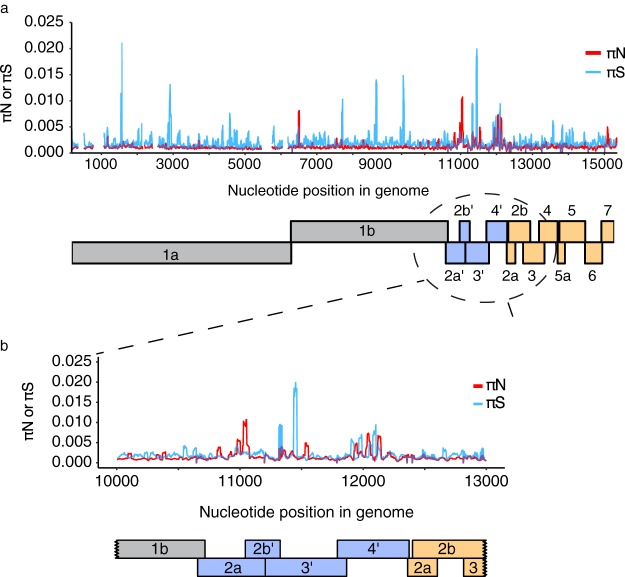
Sliding window analysis reveals peaks in KRCV-1 diversity To quantify KRCV-1 diversity on a finer scale, we calculated πN and πS measurements in sliding windows of nine codons, with a step size of one codon. Because several ORFs overlap, we performed these analyses separately for each ORF and then plotted results from every ORF as shown here. Regions with overlapping ORFs will therefore have multiple πN and πS values plotted over top each other. (a) Data for all crab-eating macaques and time points were pooled for this analysis. The πN and πS values represent the mean values at that codon across all macaques and time points. πN is shown as a red line, and πS is shown as a blue line. Below the plot is a cartoon depiction of the organization of the KRCV-1 genome. Replicase genes are shown in gray, ORFs absent in the nonsimian arteriviruses are shown in blue, and ORFs encoding structural proteins are shown in orange. (b) An enlarged rendering of the graph from panel a spanning KRCV-1 genome nucleotide 10,000 to nucleotide 13,000, between which numerous peaks in both synonymous and nonsynonymous diversity are apparent.

