FIG 6.
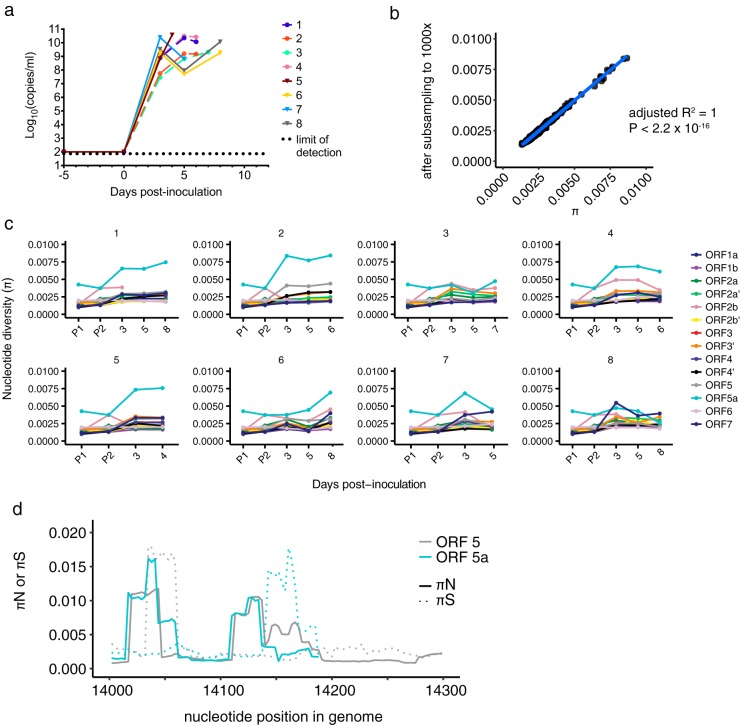
SHFV infection of crab-eating macaques leads to high diversity in ORFs 5a and 5. (a) The plasma viral RNA load is shown for each crab-eating macaque infected with SHFV. Viral loads were quantified using qRT-PCR, with the dotted line indicating the lower limit of quantification for our assay. Animals infected with KRCV-1 prior to SHFV infection are represented by the same colors and shapes (filled circles) as depicted in Fig. 2 but are shown with dashed lines. Animals infected with SHFV only are represented by solid lines with triangles. Data taken from reference 17 were replotted here. (b) π was calculated using either the original assemblies or assemblies subsampled to produce even coverage of 1,000× across the entire genome. For each ORF, animal, and time point, the corresponding π value calculated from the original assemblies is plotted on the x axis versus the π value for the same sample calculated from the subsampled assembly on the y axis. The results obtained were very similar, suggesting that uneven genome coverage likely did not impact diversity estimates. (c) Nucleotide diversity (π) was estimated for each macaque, time point, and ORF and for both SHFV stocks. (d) πN and πS were estimated using a sliding window for ORFs 5 and 5a, and the results for the region of ORF 5-ORF 5a overlap are shown in panel d. Solid lines depict πN values, while dotted lines represent πS values; ORF 5 results are shown in gray, while ORF 5a results are shown in blue.

